Best Loan App User Dashboard Design Elements in 2026: 8 Tools Compared

How we put this together: we compare official feature and pricing pages, app store listings, privacy policies and public user reviews. Prices change, so check the provider's site before you pay.
Key takeaways
- A good loan dashboard leads with balance, next payment, due date, and progress, not with marketing or secondary features.
- Figma, Penpot, and Framer cover design, prototyping, and publishing, while Miro and FigJam help teams map the dashboard journey first.
- Clear payment actions, plain-language fees, and visible help options matter more than decoration on a financial dashboard.
- Accessibility, readable numbers, and honest status updates build trust, especially when a payment is late or an application is waiting.
Quick comparison
| Name | Who it suits | Starting price | Free option | |
|---|---|---|---|---|
 Figma | Dashboard design and handoff | Free | Yes | Visit |
 Penpot | Open source dashboard design | Free | Yes | Visit |
 Framer | Publishing dashboard concepts | Free | Yes | Visit |
 Sketch | Mac dashboard design | See website | Free trial | Visit |
 Miro | Dashboard journey mapping | Free | Yes | Visit |
 FigJam | Collaborative dashboard sketching | Free | Yes | Visit |
 Uizard | Fast AI dashboard mockups | Free | Yes | Visit |
 Canva | Simple dashboard presentations | Free | Yes | Visit |
The best loan app user dashboard design elements
This article takes a different shape from a standard app list, because the topic is a set of design elements, not a single product to buy. The list below covers design and prototyping tools that teams use to build loan dashboards, with examples of the dashboard elements each tool handles well. The buying guide and FAQ then cover the practices themselves: balance clarity, payment flow, progress, trust, and accessibility.
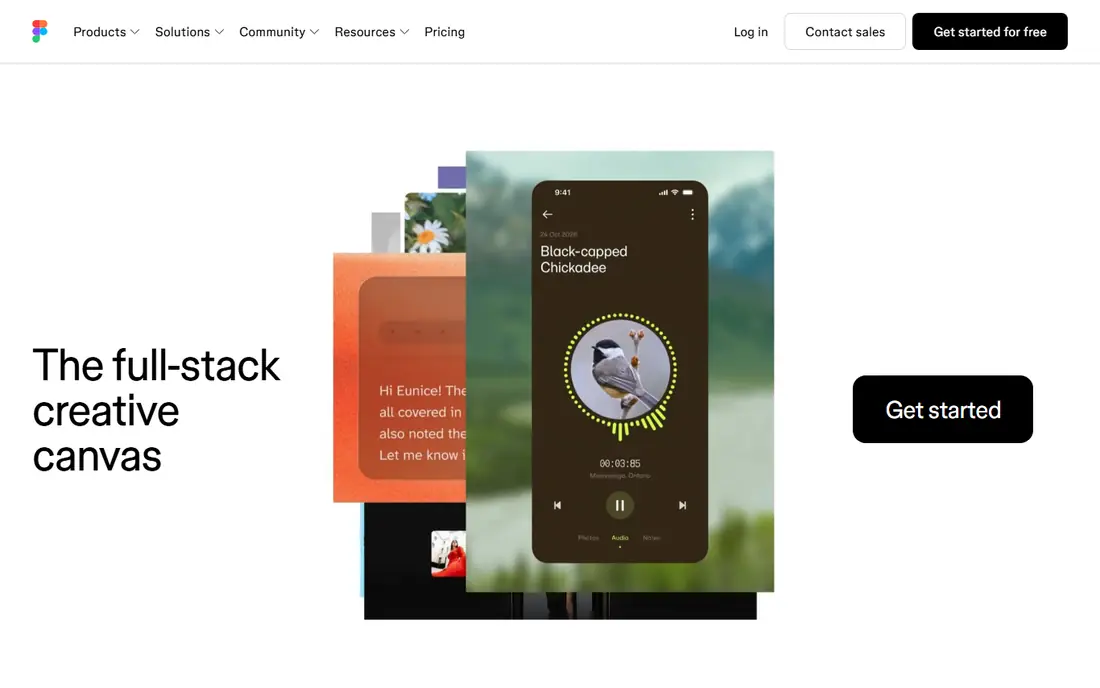
Figma is the default tool for designing a loan dashboard, and it suits the job because dashboards repeat the same elements many times: balance cards, payment rows, progress bars, and status chips. Components and variables let a team define those elements once, then reuse them across account, payment, and application screens without drifting into inconsistent numbers or labels. Prototyping then shows how a user moves from a balance view to a payment confirmation.
The pricing page lists a free Starter plan and a Professional Full seat at 16 dollars per month, billed annually, with Dev and Collab seats at lower rates. That seat model suits a product team, though it can add up at scale. For a loan dashboard, Figma's strength is not decoration, but consistency: one balance component, one payment button style, and one status pattern used everywhere.
- Components and variables for dashboards
- Strong prototyping
- Developer handoff tools
- Paid seats needed for larger teams
- Learning curve for design systems
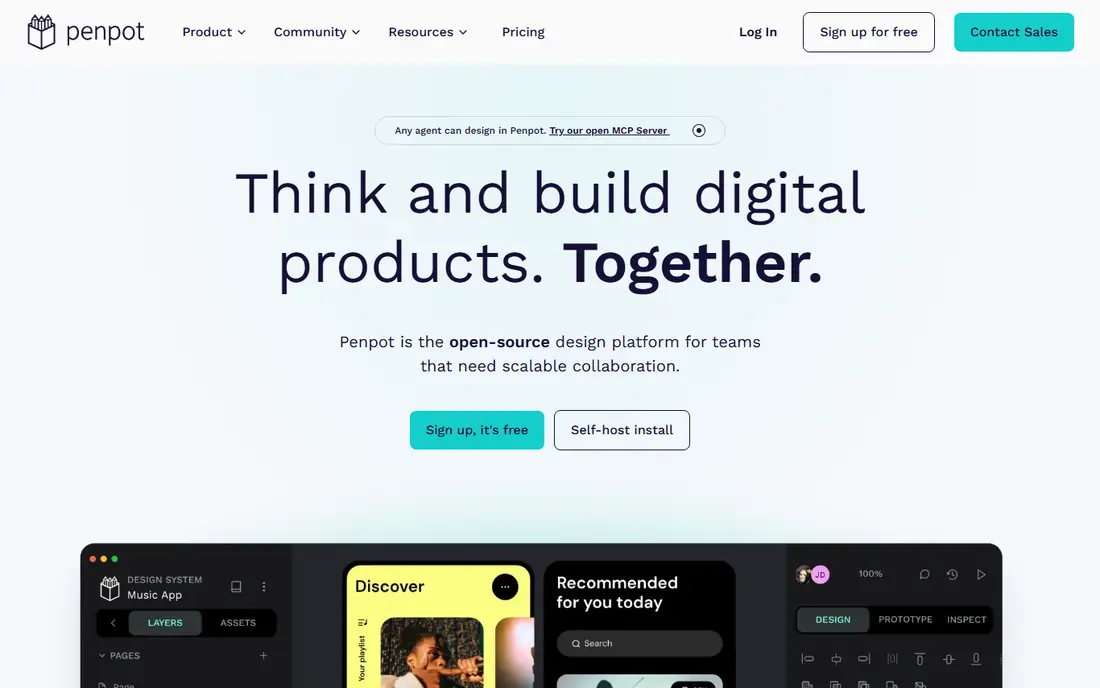
Penpot is the open source alternative for teams that want to design a loan dashboard without a per-seat subscription. It runs in the browser, supports components and prototyping, and can be self-hosted, which appeals to financial teams with strict data rules. For a dashboard, that control matters, because design files may contain realistic account examples and flows that a team prefers to keep inside its own systems.
The ecosystem is smaller than Figma, so dashboard templates and plugins are fewer, and teams may build more components from scratch. That extra work is often worth it for a small team or a regulated project. If budget and control matter more than a large template library, Penpot is a credible dashboard design tool.
- Free and open source
- Web based
- Good for teams avoiding subscription lock-in
- Smaller plugin ecosystem than Figma
- Fewer dashboard templates
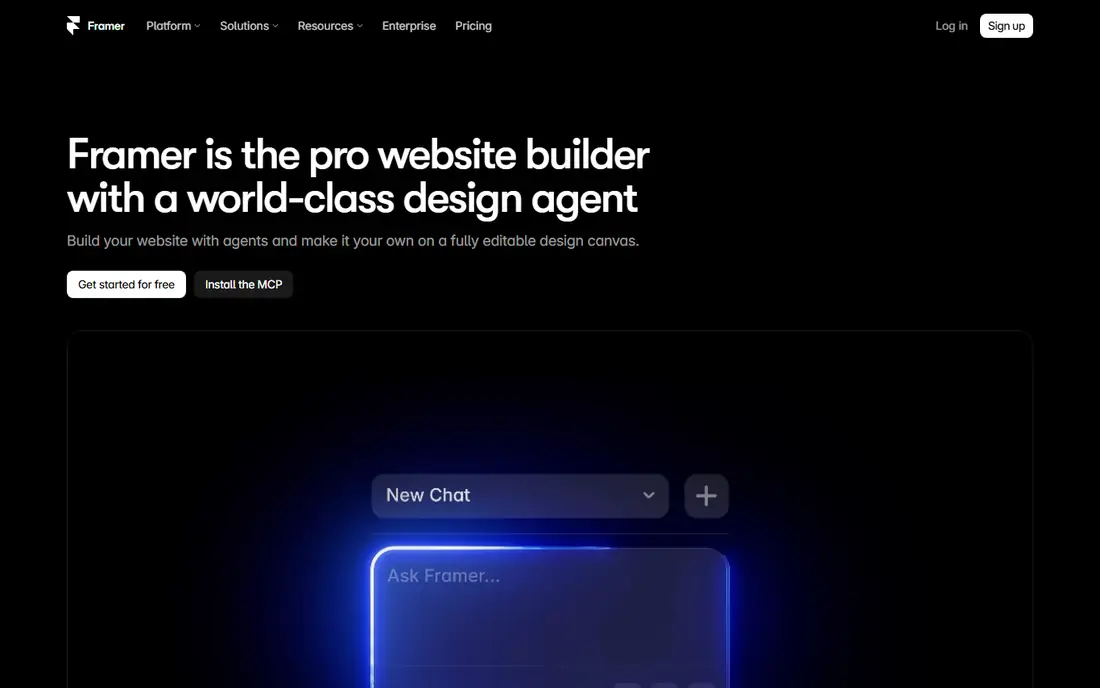
Framer suits a different stage of dashboard work: publishing an interactive concept that stakeholders can click through in a browser. A team can build a loan dashboard demo with real navigation, charts, and payment flows, then share a live link for feedback, rather than sending static screenshots. That realism helps product, compliance, and support teams spot confusing labels before development starts.
Framer charges per site, with a free plan and paid site plans, plus editor seats, so check the pricing page for a dashboard demo project. It does not replace Figma for a full design system, but for a clickable dashboard concept, it is faster than coding a prototype from scratch.
- Publishes real web pages
- Good for interactive dashboard demos
- CMS options
- Per-site pricing
- Not a full product design system tool
Sketch remains a solid choice for Mac-based teams designing a loan dashboard for iOS or a web app. Its symbols and libraries handle repeated dashboard elements well, and its focus on interface design keeps the toolset calm compared with an all-in-one platform. For a small team that already works on Mac, Sketch can cover wireframes through to high-fidelity dashboard screens.
The Mac-only limit is real, and cross-platform teams may prefer Figma or Penpot. Check the current pricing on the Sketch site, since plans and trial terms change. For a Mac team that values a focused design tool, Sketch still earns its place.
- Strong Mac design tool
- Symbols and libraries
- Good for native app dashboards
- Mac only
- Collaboration needs extra tools for some teams
Miro helps before any dashboard screen is drawn. Teams use it to map the loan journey: application, approval, first payment, missed payment, payoff, and support. That map shows where dashboard elements belong, such as a status banner during an application, a payment reminder before a due date, and a clear payoff path at the end. Without that map, dashboards often collect features that do not match the user's actual next step.
Miro is not a UI design tool, so the output is a journey and a set of screens to design elsewhere. Its free plan covers basic boards, with paid plans for larger teams. Used early, it prevents the most common dashboard mistake: designing a beautiful balance screen that does not help a user pay on time.
- Large canvas for journey maps
- Templates for flows
- Easy stakeholder collaboration
- Not a UI design tool
- Boards can grow messy without structure
FigJam is Figma's whiteboard, and it suits quick dashboard sketching in a workshop. A team can sketch a balance card, a payment flow, and a help section in one session, gather comments from product, engineering, and support, and then move the agreed layout into Figma for detailed design. That short loop helps loan teams, where compliance and support input often change wording and placement.
FigJam alone will not produce a finished dashboard, and its value depends on moving sketches into Figma promptly. The free plan covers basic use, with paid access through Figma seats. For early dashboard work, it is faster than starting in a detailed design file.
- Fast sketching in the Figma workspace
- Easy feedback
- Good for workshops
- Sketching only, not high-fidelity design
- Needs Figma for final screens
Uizard speeds up the first dashboard mockup, turning a prompt or a sketch into a set of screens that a team can discuss. That speed helps when a loan team needs to compare several dashboard layouts quickly, such as a balance-first layout versus a payment-first layout. Templates for dashboards give a starting point that is faster than a blank canvas.
AI output needs careful review, especially for financial labels, numbers, and disclosures. A mockup that looks clean can still mislabel a fee, hide a due date, or suggest a payment action that does not match the real flow. Use Uizard for exploration, then rebuild the chosen layout in Figma or Penpot with accurate content.
- Fast mockups from prompts and sketches
- Dashboard templates
- Easy sharing
- Less control than Figma
- AI output needs review for financial accuracy
Canva suits dashboard presentations rather than dashboard products. A team can turn a loan dashboard concept into a stakeholder deck, a one-page summary, or a simple mockup for a meeting, without learning a design tool. That ease helps non-designers contribute to early discussions about what a dashboard should show.
Canva is not a substitute for Figma, Penpot, or Sketch for a shipping product. It lacks component systems, prototyping depth, and developer handoff, so a Canva mockup will need rebuilding before development. Use it for communication, not for final dashboard design.
- Very easy to use
- Good for stakeholder decks
- Free plan is generous
- Not a product design tool
- No real prototyping or handoff
How we picked these
We checked official feature pages and pricing pages for design, prototyping, and collaboration tools that teams actually use for dashboard work, and we favored tools that are actively maintained in October 2026. We looked for coverage across journey mapping, high-fidelity design, prototyping, and stakeholder presentation, rather than picking eight tools that all do the same job. We also weighed pricing, since dashboard projects range from a solo designer to a large product team.
We did not rank tools by popularity alone. A popular presentation tool is not a good dashboard design tool, and a niche open source tool can be the right choice for a regulated team. The list is built to match tools to stages of dashboard work, from journey map to shipped screen.
Buying guide: the loan dashboard elements that matter most
A loan dashboard has one job: help a borrower understand what they owe, what is due next, and what to do now. Every element below should serve that job, and anything that does not should be moved to a secondary screen.
Lead with balance, next payment, and progress
Put outstanding balance, next payment amount, due date, and repayment progress at the top, in large, readable numbers. Show interest and fees where relevant, and explain any number that is not obvious. A progress bar for repayment helps, but only if it matches the real loan terms and updates correctly.
Make payment and help easy to find
The primary payment action should be clear, with a preview of amount, date, and method before confirmation. Show application status, outstanding requirements, and the next step separately from the repayment view, so applicants and borrowers each see what matters to them. Help, contact options, and hardship information should be easy to find, not hidden in a menu.
Build trust with plain language and accessibility
Use plain words for fees, rates, and deadlines, and avoid jargon that hides cost. Use enough color contrast, readable text sizes, and clear labels for screen readers, and do not rely on color alone to show status. Test the dashboard with real borrowers, including people who are behind on a payment, since stress makes confusing design worse.
Frequently asked questions
What should a loan app dashboard show first?
Outstanding balance, next payment amount, due date, and repayment progress should come first. Those four items answer the most common borrower questions, and everything else, such as statements, settings, and offers, belongs further down or on secondary screens.
How should a loan dashboard handle a missed payment?
Show the missed payment clearly, with the amount due, any fees, and the next step to catch up, in plain language. Offer help and contact options nearby, and avoid shaming language or hiding the path to payment behind several taps.
Should a loan dashboard show interest and fees?
Yes, where they apply. Show interest, fees, and total repayment in a clear breakdown, not just a final balance. Borrowers make better decisions when they can see what a payment covers and what remains.
What makes a loan dashboard accessible?
Readable text, strong contrast, clear labels, keyboard navigation, and status shown by text as well as color. Test with screen readers and with users who have low vision, and avoid tiny numbers or low-contrast grey text for important amounts.
Do loan dashboards need charts?
Charts help when they clarify progress or payment history, such as a repayment progress bar or a simple payment timeline. Avoid decorative charts that do not help a borrower decide what to do next, and always label axes and values in plain words.
Which tool is best for designing a loan dashboard?
Figma is the best all-round choice for most product teams, with components, prototyping, and handoff. Penpot suits open source or regulated teams, Framer suits interactive demos, and Miro or FigJam suit early journey mapping before detailed design starts.
Sources we checked (8)

Online Jobs is an independent blog about careers, online work, learning new skills and the tools that help people earn. More about us.
Keep reading
All posts
Best AI Text to Vector Tools
Looking for the best AI text to vector tool? We compare 8 tools that turn prompts or images into editable SVG vectors for logos, icons, branding, and print.
n8n Alternatives
n8n alternatives compared for 2026, with Zapier, Make, Activepieces, and more, covering visual builders, code steps, self-hosting, and pricing models.
eBay Alternatives
Looking for ebay alternatives? We compared 9 marketplaces for sellers on fees, buyer reach, categories and ease of listing, to help you sell with confidence.