Datadog Alternatives in 2026: 8 Tools Compared


All-in-one observability with a free tier · Starting price: Free
How we put this together: we compare official feature and pricing pages, app store listings, privacy policies and public user reviews. Prices change, so check the provider's site before you pay.
Key takeaways
- New Relic is the easiest Datadog replacement for teams that want a real free tier and usage-based pricing.
- Grafana Cloud suits teams already using Prometheus and open standards who want to avoid lock-in.
- Dynatrace and Splunk suit large enterprises that need automatic discovery and deep analysis at scale.
- Honeycomb and Sentry suit teams that debug complex traces or application errors rather than whole infrastructure.
- Observability bills are driven by hosts, data volume and retention, so model your own numbers before you pick a vendor.
Quick comparison
| Name | Who it suits | Starting price | Free option | |
|---|---|---|---|---|
| New Relic | All-in-one observability with a free tier | Free | Yes | Visit |
 Dynatrace | Enterprise automatic root cause analysis | See website | Free trial | Visit |
 Grafana Cloud | Open-source observability stacks | Free | Yes | Visit |
 Splunk Observability Cloud | Large teams already in the Splunk world | See website | Free trial | Visit |
 Elastic Observability | Search-led logs and APM | See website | Free trial | Visit |
 Honeycomb | Trace-first debugging | See website | Yes | Visit |
 Sentry | Error tracking plus performance monitoring | $26 per month | Yes | Visit |
 LogicMonitor | Mixed on-prem and cloud infrastructure | See website | Free trial | Visit |
The best datadog alternatives
Datadog packs infrastructure monitoring, APM, logs and security into one platform, which is also why its bill can surprise teams at scale. The alternatives below split that job in different ways, from full platforms to focused debugging tools.
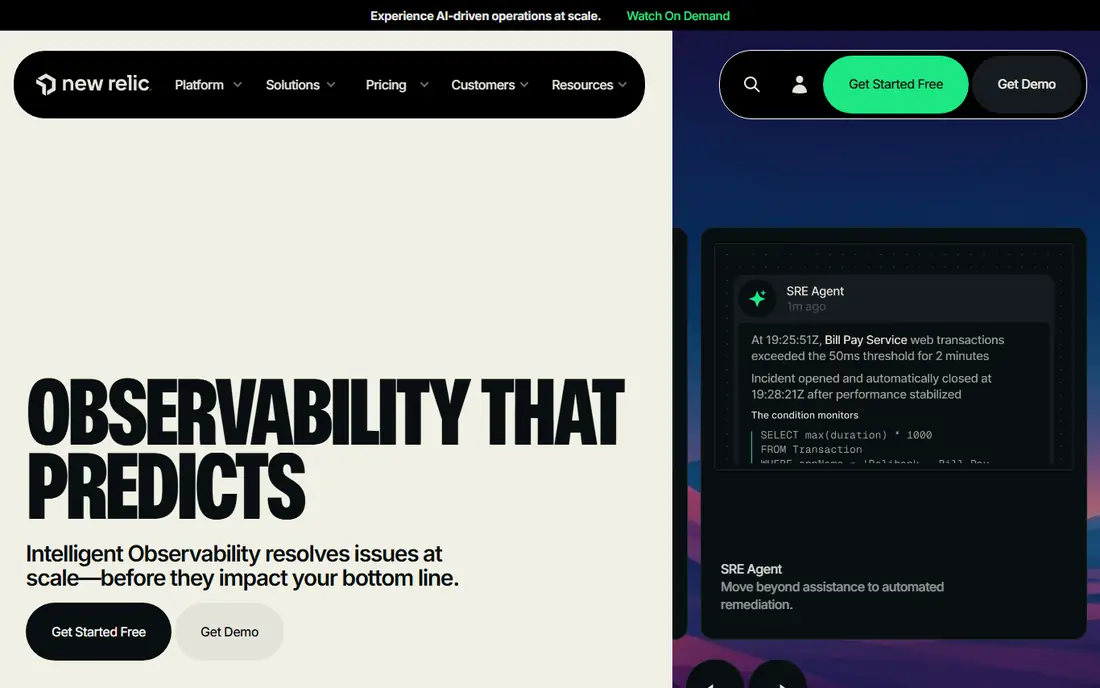
New Relic is our pick for most teams leaving Datadog. It covers infrastructure, APM, logs and browser monitoring in one place, and the free tier lets a small team start without a sales call. Paid pricing is based on data ingest and users rather than per host alone, which can make costs easier to predict for teams with many small hosts.
The learning curve is real. New Relic Query Language is powerful, but new users often need a week or two before dashboards feel natural. Data volume is still the main cost driver, so set retention and sampling rules early. If you want one platform to replace Datadog with the least friction, start here.
- Free tier with generous data ingest
- Full-stack coverage in one platform
- Usage-based pricing
- Query language takes time to learn
- Costs still rise with data volume and full users
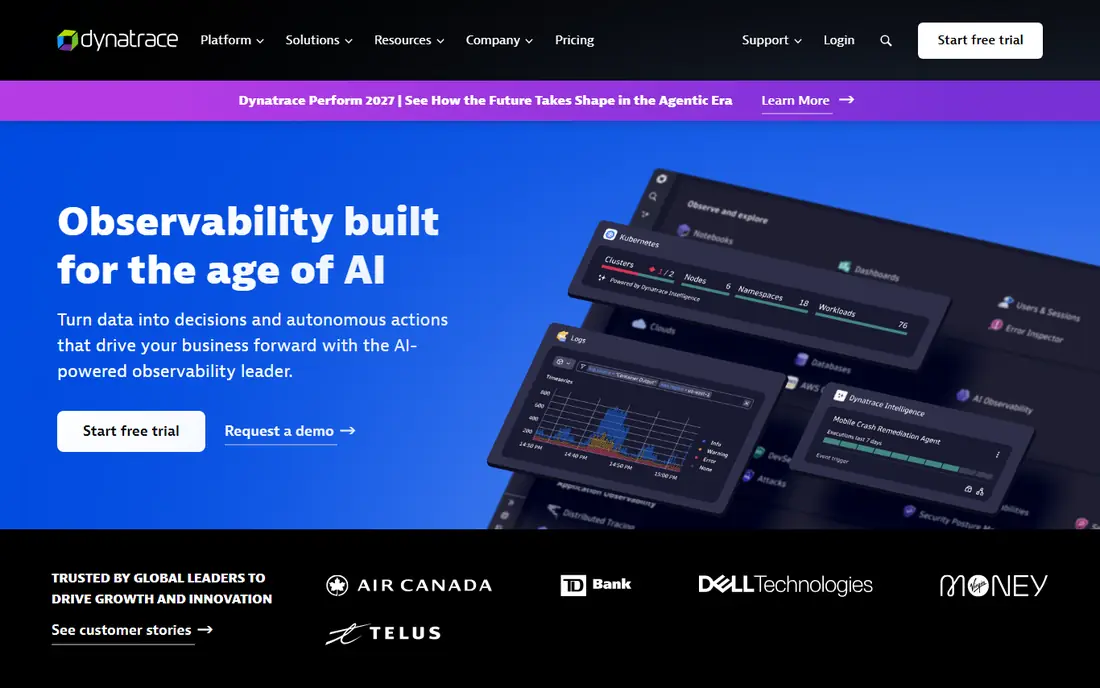
Dynatrace suits large, complex environments where nobody can draw the full system map by hand. Its agent discovers services and dependencies automatically and its analysis engine points to likely root causes instead of leaving engineers to correlate charts. For enterprises with hundreds of services, that automation is the main selling point.
The cost is the catch. Dynatrace is sold on a quote basis and enterprise pricing adds up quickly, especially with full-stack monitoring on many hosts. Smaller teams will find New Relic or Grafana Cloud simpler and cheaper. Dynatrace earns its price when automatic discovery saves real incident time across a large estate.
- Automatic discovery and topology mapping
- AI-assisted root cause analysis
- Broad enterprise coverage
- Quote-led pricing
- Can be expensive at scale
- Depth takes time to configure well
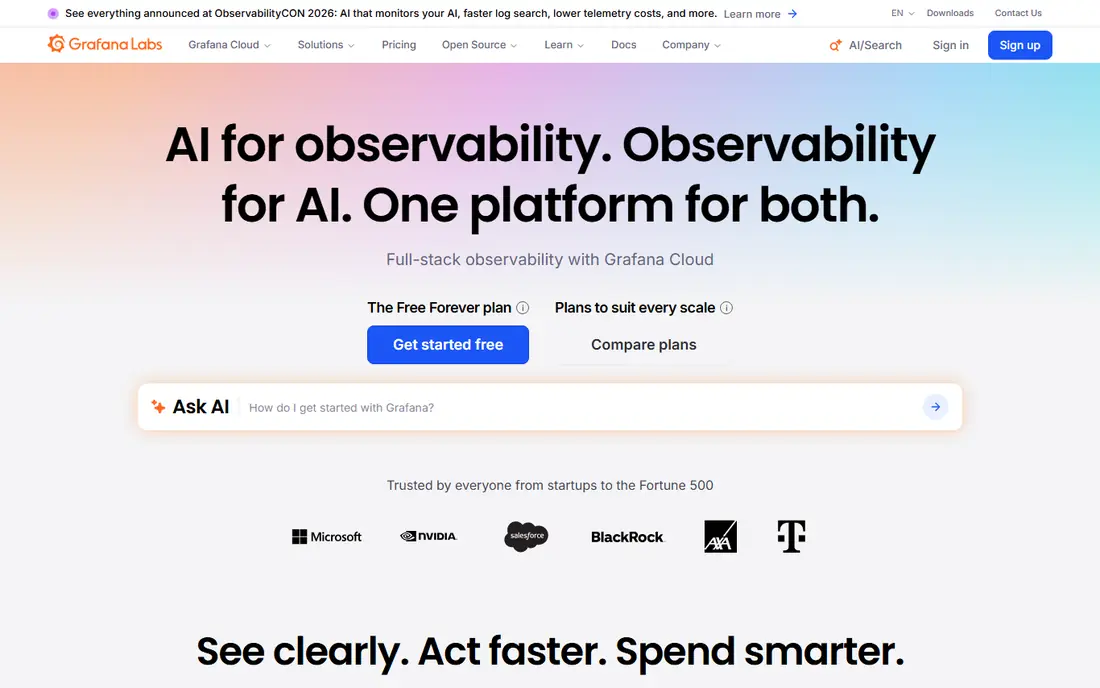
Grafana Cloud is the managed home of the open-source observability stack. Teams that already run Prometheus for metrics, Loki for logs and Tempo for traces can keep those tools and add managed scale, dashboards and alerting. It avoids vendor lock-in better than any closed platform on this list, since the underlying standards are open.
That freedom comes with assembly work. You still need to choose exporters, set retention and build dashboards, and the managed bill grows with data volume plus a platform fee. Grafana Cloud suits engineering-led teams who like open tools and are happy to own their setup. Teams that want everything pre-built may prefer New Relic.
- Built on Prometheus, Loki and Tempo
- Free tier for small teams
- Flexible data sources
- Assembly required
- Managed costs rise with usage
- Support depth varies by plan
Splunk Observability Cloud
Who it suits: Large teams already in the Splunk world
Splunk Observability Cloud fits organisations that already use Splunk for logs or security and want monitoring in the same ecosystem. Its streaming analytics handle high-volume telemetry well, and the link to security tooling helps teams that investigate incidents across both performance and security data. For a large enterprise, that shared platform can be a real advantage.
For everyone else, Splunk is a heavy choice. Pricing is quote-led, the product range is broad, and new teams can take time to find their way around it. If you are not already a Splunk shop, New Relic or Dynatrace will usually get you live faster. If you are, Splunk is the natural Datadog alternative to evaluate first.
- Strong log analytics and streaming analysis
- Deep enterprise integrations
- Security crossover
- Quote-led pricing
- Complex pricing model
- Steep learning curve for new users
Elastic Observability is built on Elasticsearch, so it shines when the job is searching huge volumes of logs and traces quickly. Teams that already run the Elastic Stack can add APM and infrastructure monitoring without a second platform, and the self-hosted option gives full control over data and costs. That control matters for regulated teams and for teams with existing Elastic skills.
The trade-off is operational load. Running Elasticsearch well takes memory, storage planning and tuning, and even the managed cloud price moves with usage. Elastic suits log-heavy teams with search skills in house. Teams that want a turnkey APM product with minimal tuning may prefer New Relic or Sentry.
- Powerful search across logs and traces
- Self-hosted option
- Flexible deployment
- Resource needs can be high
- Managed cloud pricing varies with usage
- Setup takes care
Honeycomb takes a different approach from Datadog: instead of pre-built dashboards, it lets engineers ask new questions of raw trace data on the fly. That suits teams debugging complex distributed systems, where the failing request pattern is not known in advance. High-cardinality fields let you slice traces by user, build, region or any other attribute without re-instrumenting.
Honeycomb is not a full infrastructure replacement. Host metrics, network monitoring and log management are lighter here, so many teams pair it with Grafana or a cloud monitor. Event-based pricing also needs careful modelling at volume. Choose Honeycomb when debugging speed matters more than having every monitor in one place.
- High-cardinality tracing
- Fast exploratory queries
- Free plan for small teams
- Less infrastructure monitoring depth
- Pricing is event-based and needs modelling
Sentry starts from the developer's view: when an app throws an error, Sentry groups it, shows the stack trace, the affected release and the user impact, and links it to performance data. That makes it the best Datadog alternative for teams whose main pain is application errors rather than server metrics. The free developer plan is genuinely useful for small projects.
Sentry does not replace infrastructure monitoring. Host health, network and cloud service metrics still need another tool, and event volume drives the bill on larger apps. Most teams use Sentry alongside Grafana Cloud or New Relic. If your incidents start with a user-facing error, Sentry belongs in the stack regardless of which platform you pick for the rest.
- Excellent error grouping and context
- Performance monitoring included
- Free developer plan
- Not a full infrastructure monitor
- Costs rise with event volume
- Log coverage is limited
LogicMonitor fits IT teams running a mix of on-prem servers, network devices and cloud services. It discovers devices, monitors them out of the box with many templates, and adds anomaly detection to cut alert noise. For a hybrid estate, that breadth is more useful than a cloud-only APM tool that ignores the data centre.
The limits show up in application depth. LogicMonitor covers APM, but teams with complex distributed tracing needs may still want Honeycomb or New Relic alongside it. Pricing is quote-led, so get a written quote based on your device and resource counts. LogicMonitor is the pick when infrastructure breadth, across old and new systems, is the priority.
- Broad device and cloud coverage
- AIOps features
- Good for hybrid estates
- Quote-led pricing
- Less APM depth than specialist tools
- Setup can be involved
How we picked these
We compared official feature and pricing pages, plus public reviews, and kept only tools that are live and actively sold in October 2026. We looked for coverage of Datadog's main jobs: infrastructure monitoring, APM, logs and error tracking. Where a price could not be verified on the vendor's own page, we wrote "See website" rather than guessing. We did not claim hands-on testing; our comparison rests on published features, pricing and integrations.
How to keep observability costs under control
Model your bill before you sign. List your host count, monthly data ingest, log retention period and number of full users, then ask each vendor to price that exact shape. Two vendors can look similar on a headline price and differ sharply once data volume is counted. Set retention limits and sampling rules on day one, since those two settings drive most surprise bills.
Run a side-by-side trial
Send the same telemetry to your current tool and to one alternative for two weeks. Compare alert quality, dashboard speed and the time it takes a new engineer to find a real incident. Price matters, but the tool your team actually opens during an outage is the one worth paying for.
Frequently asked questions
What are the best Datadog alternatives?
New Relic is the best all-round Datadog alternative for most teams, Grafana Cloud leads for open-source stacks, and Dynatrace leads for large enterprises. Honeycomb and Sentry are strong specialist choices for tracing and error tracking.
What is the best alternative to Datadog for startups?
New Relic is usually the best startup choice because its free tier covers real usage and paid pricing scales with data rather than a large upfront commitment. Grafana Cloud is a strong second choice for teams already using Prometheus.
Is Grafana a good Datadog alternative?
Yes, for teams comfortable with open-source tools. Grafana Cloud covers metrics, logs and traces through Prometheus, Loki and Tempo, and it avoids lock-in. It needs more assembly than Datadog or New Relic, so factor setup time into the decision.
Why do teams leave Datadog?
Teams most often leave because of cost at scale, since bills grow with hosts, data volume and retention. Some also leave for simpler pricing, open standards or a specialist tool that debugs traces or errors better than a general platform.
Does Dynatrace have a free plan?
Dynatrace offers a free trial rather than a permanent free plan, and paid pricing is quote-led. Teams that want a permanent free tier should look at New Relic, Grafana Cloud, Honeycomb or Sentry first.
Sources we checked (8)

Online Jobs is an independent blog about careers, online work, learning new skills and the tools that help people earn. More about us.
Keep reading
All posts
n8n Alternatives
n8n alternatives compared for 2026, with Zapier, Make, Activepieces, and more, covering visual builders, code steps, self-hosting, and pricing models.

ZoomInfo Alternatives
The best ZoomInfo alternatives in 2026, compared on price, free plans, data coverage, and which tool fits small teams or large sales teams best in detail.

Zoom Alternatives for Webinars
Compare Zoom alternatives for webinars in 2026, from browser-based rooms to enterprise events, with prices, attendee limits, features and honest trade-offs.