Best System Monitoring Software in 2026: 9 Tools Compared

How we put this together: we compare official feature and pricing pages, app store listings, privacy policies and public user reviews. Prices change, so check the provider's site before you pay.
Key takeaways
- Datadog and Dynatrace suit teams that need infrastructure, application, and log data in one platform, with strong alerting and dashboards.
- New Relic is a strong application monitoring choice, especially for teams that need to trace a slow request across services.
- Zabbix, Nagios, and Grafana suit teams that want open source control and lower licence costs, though setup and maintenance take more work.
- PRTG and ManageEngine OpManager fit network and server monitoring for IT teams that want a clear device and sensor view.
- The best monitoring tool is the one that alerts on real problems without flooding the team, and that shows the cause, not just a red dashboard.
Quick comparison
| Name | Who it suits | Starting price | Free option | |
|---|---|---|---|---|
 Datadog | Cloud infrastructure and apps | See website | Free trial | Visit |
 New Relic | Application performance | See website | Yes | Visit |
 Dynatrace | Full stack observability | See website | Free trial | Visit |
 SolarWinds | IT infrastructure monitoring | See website | Free trial | Visit |
 PRTG | Network and server sensors | See website | Yes | Visit |
 Zabbix | Open source infrastructure | Free | Yes | Visit |
 Nagios | Open source server checks | Free | Yes | Visit |
 Grafana | Dashboards and visualisation | Free | Yes | Visit |
 ManageEngine OpManager | Network and server management | See website | Free trial | Visit |
The best system monitoring software
System monitoring covers servers, networks, applications, and logs. A good tool collects metrics, alerts when thresholds break, and helps a team find the cause before users report it. We compared nine tools that are still active in October 2026, looking at coverage, alerting, dashboards, and pricing model.
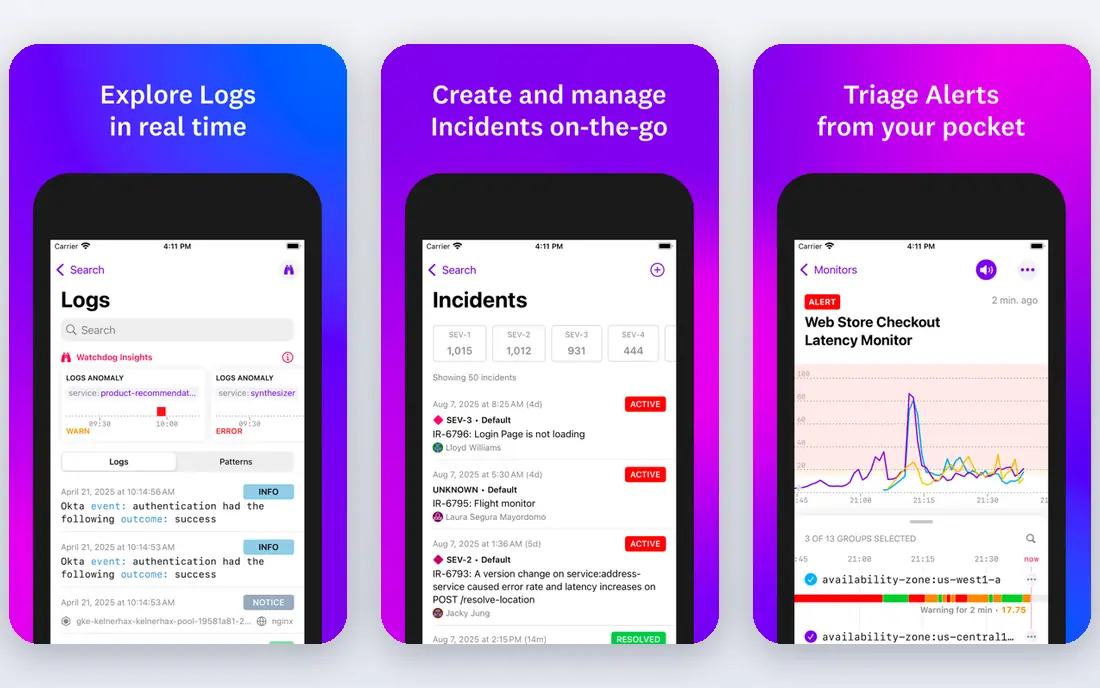
Datadog is a popular choice for cloud and container teams because it brings many data types together. A team can see host metrics, application traces, logs, and synthetic checks in one place, and correlate a slow page with a busy host or a failing service. Integrations cover major cloud providers, Kubernetes, databases, and common tools, which speeds up initial setup.
Usage based pricing is the main risk. Ingested logs, custom metrics, and monitored hosts all add cost, so a team should set retention and metric limits early. For a cloud team that needs one observability platform and can manage usage, Datadog is a strong and flexible choice.
- Infrastructure, application, log, and synthetic monitoring in one platform
- Many integrations for cloud and containers
- Strong dashboards and alerts
- Pricing is usage based and can grow quickly
- Breadth takes time to configure well
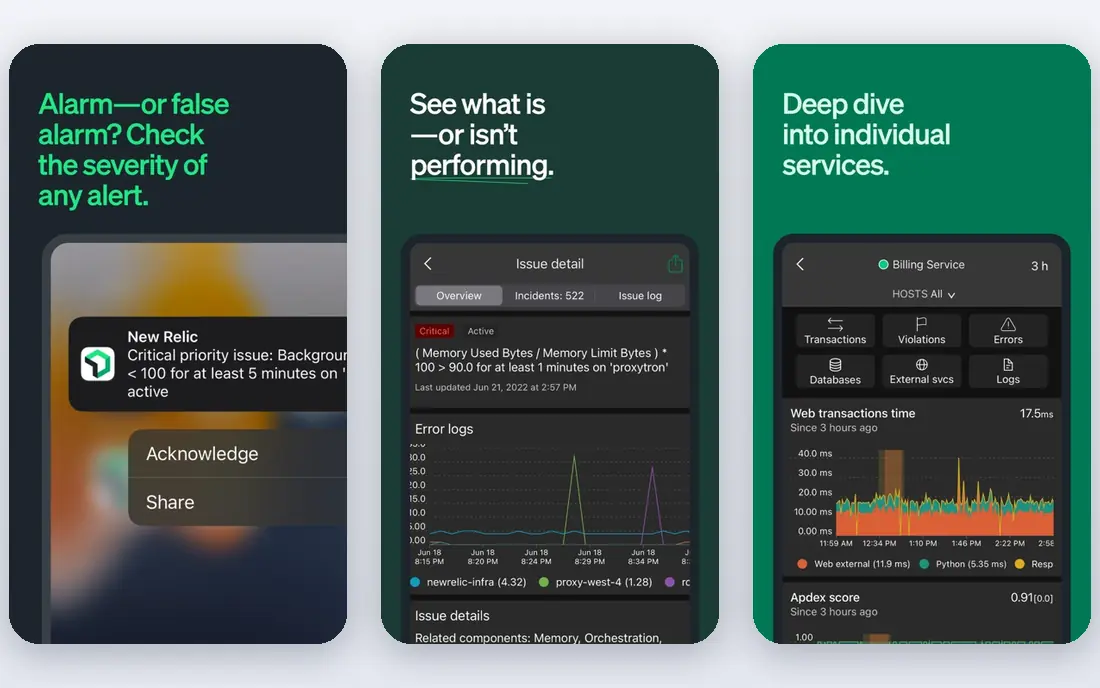
New Relic helps developers answer why an application is slow. Traces show a request moving through services and databases, errors are grouped by cause, and dashboards track key transactions over time. That application focus makes it a good fit for software teams whose main risk is code performance rather than network hardware.
A free tier covers small use, while larger use is usage based, so costs depend on data volume and users. Teams that mainly monitor servers and networks may prefer PRTG, Zabbix, or OpManager, but a team that lives in application code will find New Relic's traces hard to replace.
- Deep application tracing across services
- Dashboards and alerts for errors and slow transactions
- Free tier for small use
- Full platform pricing is usage based
- Infrastructure features are lighter than Datadog for some teams
Dynatrace aims to map an entire environment automatically, from hosts and containers to services and user sessions. Its problem detection groups related alerts into a single root cause, which reduces the alert noise that burns out on call teams. For a large or complex system, that automatic mapping saves weeks of manual dashboard building.
Pricing is custom for larger deployments, and the platform rewards teams that invest in onboarding. Smaller teams may find Datadog or New Relic simpler to start, but an enterprise with many services and strict uptime needs will benefit from Dynatrace's breadth and root cause focus.
- Automatic discovery of services and dependencies
- AI assisted problem detection
- Full stack view from infrastructure to user experience
- Pricing is custom for larger use
- Platform depth needs onboarding
SolarWinds has long served IT teams that monitor networks, servers, storage, and applications from one console. Its modules let a team add network performance, server health, and application checks as needed, with alerting and reporting suited to IT operations. On premises deployment suits organisations that keep monitoring inside their own network.
Module pricing makes total cost harder to compare at a glance, and the platform is heavier than a simple sensor tool. For a mid sized or large IT team with diverse infrastructure, SolarWinds offers depth and control. For a small team, PRTG or Zabbix may be simpler and cheaper.
- Broad IT monitoring for networks, servers, and applications
- Mature alerting and reporting
- On premises deployment option
- Pricing is module based and needs a quote
- Interface and setup feel enterprise heavy for small teams
PRTG from Paessler uses sensors to monitor a device, service, or metric, which makes it easy to understand what is covered. A router, a server disk, a website, and a database each get sensors, and maps show status at a glance. That model suits IT teams that think in devices and services rather than code traces.
The free version covers a limited number of sensors, which suits a home lab or small office. Larger networks need a paid licence based on sensor count, so count sensors before budgeting. For network and server monitoring with clear visual maps, PRTG is a practical and proven choice.
- Sensor based monitoring for networks, servers, and devices
- Clear maps and dashboards
- Free version for a limited sensor count
- Windows based core server
- Costs grow with sensor count
Zabbix is a mature open source monitor for networks, servers, virtual machines, and cloud services. Templates cover common devices and applications, triggers define alert conditions, and dashboards show health across the estate. There is no licence fee, which makes it attractive for schools, small businesses, and IT teams with in house skills.
The cost moves from licences to labour. Someone must install, update, tune triggers, and maintain the server, and alert rules need care to avoid noise. Teams with that capacity get a powerful monitor for the price of hosting. Teams without it may prefer a managed or simpler commercial tool.
- Open source with no licence cost
- Monitors networks, servers, cloud, and services
- Flexible triggers, templates, and dashboards
- Setup and tuning take technical skill
- Interface is functional rather than polished
Nagios is one of the oldest monitoring tools still in wide use, and its strength is simple, reliable checks. Hosts and services are checked on a schedule, alerts go out when a check fails, and plugins cover almost any device or application. Many IT teams still run Nagios Core for core uptime checks beside a newer dashboard tool.
Configuration takes more manual work than modern tools, and the default interface is plain. Add ons and commercial editions improve dashboards and reporting, but they add cost and complexity. For a team that wants dependable checks and full control, Nagios Core remains a solid and free foundation.
- Open source core with a huge plugin ecosystem
- Reliable host and service checks
- Long track record in IT operations
- Configuration is file based and manual
- Dashboards and reporting are basic without add ons
Grafana is best understood as the dashboard layer for monitoring. It pulls metrics from Prometheus, InfluxDB, cloud tools, and many other sources, then turns them into clear graphs, alerts, and status boards. Teams often pair Grafana with Prometheus for metrics, which gives a powerful open source stack with no licence cost for the core tools.
Grafana alone does not collect server or network metrics, so a team still needs a collector or agent. That extra piece is worth planning, because a beautiful dashboard on thin data does not help. For teams that already collect metrics, Grafana is the best way to make them readable and actionable.
- Excellent dashboards and alerts from many data sources
- Open source core plus cloud option
- Strong community plugins
- Not a full monitor on its own, it visualises data from other tools
- Setup needs a data source plan
ManageEngine OpManager suits IT teams that need to watch networks, servers, and virtual machines together. Discovery finds devices, maps show topology, and monitors track availability, performance, and faults. Workflows automate common responses, such as restarting a service or raising a ticket, which helps small IT teams handle more devices.
Pricing depends on device count and edition, so a trial and a device count are needed for a real quote. Very small teams may find PRTG or Zabbix simpler, but a mid sized IT team that wants network and server monitoring in one console will find OpManager a tidy fit.
- Network, server, and virtualisation monitoring in one console
- Device discovery and maps
- Workflows for common IT tasks
- Pricing is device based and needs a check
- Breadth can overwhelm a very small team
How we picked these
We looked for tools that are still active in October 2026 and that cover a distinct monitoring job, namely application performance, infrastructure, network, and dashboards. For each tool, we checked the vendor site for its stated coverage and pricing model, and we kept only tools with a working official homepage. We favoured tools with a clear alerting and dashboard story over tools that only collect metrics.
We did not rank tools on uptime or performance claims that we could not verify. Where pricing is usage or device based, we say so. Before choosing, monitor a real system for two weeks, tune alerts, and check that the team can find a cause from an alert without opening five other tools.
Setting up monitoring that helps
Alert on user impact first
Start with checks that mirror what users feel, such as website uptime, login success, and key transaction speed, then add infrastructure checks behind them.
Tune alerts before adding more checks
A noisy alert system gets ignored. Review alerts weekly at first, raise thresholds for known noise, and group related alerts into one problem where possible.
Keep one dashboard per audience
An on call engineer needs a different view from a manager. Build a short operational dashboard for incidents and a separate summary dashboard for trends.
Plan data retention and cost
Decide how long to keep detailed metrics and logs. Long retention helps investigations but raises usage costs on cloud platforms, so set limits early.
Frequently asked questions
What is the best monitoring tool for a PC?
For a single PC, a lightweight system monitor or a tool like PRTG with a few sensors can track CPU, disk, and network use. For a fleet of PCs, Zabbix, OpManager, or SolarWinds give central dashboards and alerts that a single PC tool cannot.
What is the best tool for application monitoring?
New Relic, Datadog, and Dynatrace are the strongest application monitoring platforms on this list. New Relic suits code level tracing, Datadog suits cloud teams that want infrastructure beside apps, and Dynatrace suits large full stack environments.
Are there free system monitoring tools?
Yes, Zabbix, Nagios Core, and Grafana are open source and free to run, though hosting and maintenance are still needed. PRTG offers a free version for a limited sensor count, and New Relic offers a free tier for small use.
What is the best PC performance monitoring software for a small business?
PRTG and Zabbix are good small business choices, with PRTG offering simpler setup and Zabbix offering no licence cost. For a business that also needs application tracing, Datadog or New Relic may be worth the usage cost.
How do I reduce alert noise?
Group related alerts, set thresholds based on real incidents, and add a short delay for transient spikes. Review alerts weekly until the team trusts that an alert means action is needed.
Do I need both Grafana and another monitor?
In many setups yes, because Grafana visualises data while another tool collects it. A common pair is Prometheus for collection and Grafana for dashboards, or Grafana beside Datadog or Zabbix for a custom status view.
Sources we checked (9)

Online Jobs is an independent blog about careers, online work, learning new skills and the tools that help people earn. More about us.
Keep reading
All posts
n8n Alternatives
n8n alternatives compared for 2026, with Zapier, Make, Activepieces, and more, covering visual builders, code steps, self-hosting, and pricing models.

ZoomInfo Alternatives
The best ZoomInfo alternatives in 2026, compared on price, free plans, data coverage, and which tool fits small teams or large sales teams best in detail.
Workday Alternatives
We compared the best workday alternatives for HR, payroll, and global hiring, from BambooHR and Gusto to Rippling, Deel, and HiBob for growing teams in 2026.