Best Stock Tracking Apps in 2026: 8 Tools Compared


Everyday investors who want watchlists, portfolios, and news together · Starting price: Free
How we put this together: we compare official feature and pricing pages, app store listings, privacy policies and public user reviews. Prices change, so check the provider's site before you pay.
Key takeaways
- Yahoo Finance suits most investors for watchlists, portfolios, and news in one free app.
- TradingView suits chart-focused investors who want advanced technical analysis and custom layouts.
- Seeking Alpha and Morningstar suit research-led investors who want analyst coverage and valuation context.
- Free tiers cover quotes, charts, and basic portfolios well, but real-time data depth and premium research need paid plans.
- This guide is for tracking and research only, and it is not financial advice. Check data delays and fees before acting on any quote.
Quick comparison
| Name | Who it suits | Starting price | Free option | |
|---|---|---|---|---|
| Yahoo Finance | Everyday investors who want watchlists, portfolios, and news together | Free | Yes | Visit |
 TradingView | Chart-focused investors and active traders | Free | Yes | Visit |
 Seeking Alpha | Research-led investors who want analysis and ratings context | See website | Yes | Visit |
 Morningstar | Fund and stock research with analyst ratings | See website | Yes | Visit |
 Investing.com | Global market data plus an economic calendar | Free | Yes | Visit |
 Stocktwits | Watching market chatter and sentiment around a ticker | Free | Yes | Visit |
 Koyfin | Investors who want clean financial data visualisation | Free | Yes | Visit |
 StockCharts | Classic technical charting with a long indicator tradition | Free | Yes | Visit |
The best stock tracking apps
A stock tracking app should answer three questions fast: what a stock costs now, how a portfolio is performing, and what news or data changed the picture. The apps below differ in chart depth, research quality, and social features. Some suit beginners who want a clean watchlist, others suit active chart readers or research-led investors. Data delays, exchange coverage, and alert limits matter as much as design, so check those details for the markets you follow.
Yahoo Finance
Who it suits: Everyday investors who want watchlists, portfolios, and news together
Yahoo Finance remains the default starting point for stock tracking. Watchlists, portfolios, streaming US quotes, basic charts, company profiles, and a broad news feed cover most daily needs without payment. The app is easy to scan, and the web version adds screeners with filters for market cap, sector, dividend yield, and other basics. For a beginner or a long-term holder checking holdings a few times a week, the free tier is enough.
Paid tiers add advanced charting, portfolio analytics, and premium research, with Bronze, Silver, and Gold tiers listed on the vendor pricing page at different monthly rates. Ads interrupt the free experience, and chart customisation trails TradingView. Still, as a single free app for tracking plus news, Yahoo Finance is hard to beat. Remember that quotes may carry delays by exchange, so confirm real-time status for your market.
- Free watchlists and portfolios, broad news feed, company profiles and basic financials
- Ads on free tier, advanced charting and analytics need paid tiers

TradingView is the charting standard for many active investors. Charts load fast, indicators cover most technical methods, and layouts can combine several charts, watchlists, and news in one screen. The social feed adds trade ideas and analysis from other users, which some readers use for perspective and others ignore entirely. Free real-time data for major US exchanges, through available feeds, makes the free tier genuinely useful for chart work.
Free limits shape daily use: fewer indicators per chart and fewer saved layouts than paid plans. Upgrade prompts appear often, and full real-time depth for some exchanges needs paid data. Paid plans start near $14.95 per month in commonly listed pricing, with higher tiers adding more indicators, layouts, and alerts. For investors who read charts daily, TradingView earns its place alongside a portfolio tracker.
- Strong charting tools, custom layouts, large indicator library, social ideas feed
- Free plan limits indicators and layouts, frequent upgrade prompts
Seeking Alpha
Who it suits: Research-led investors who want analysis and ratings context
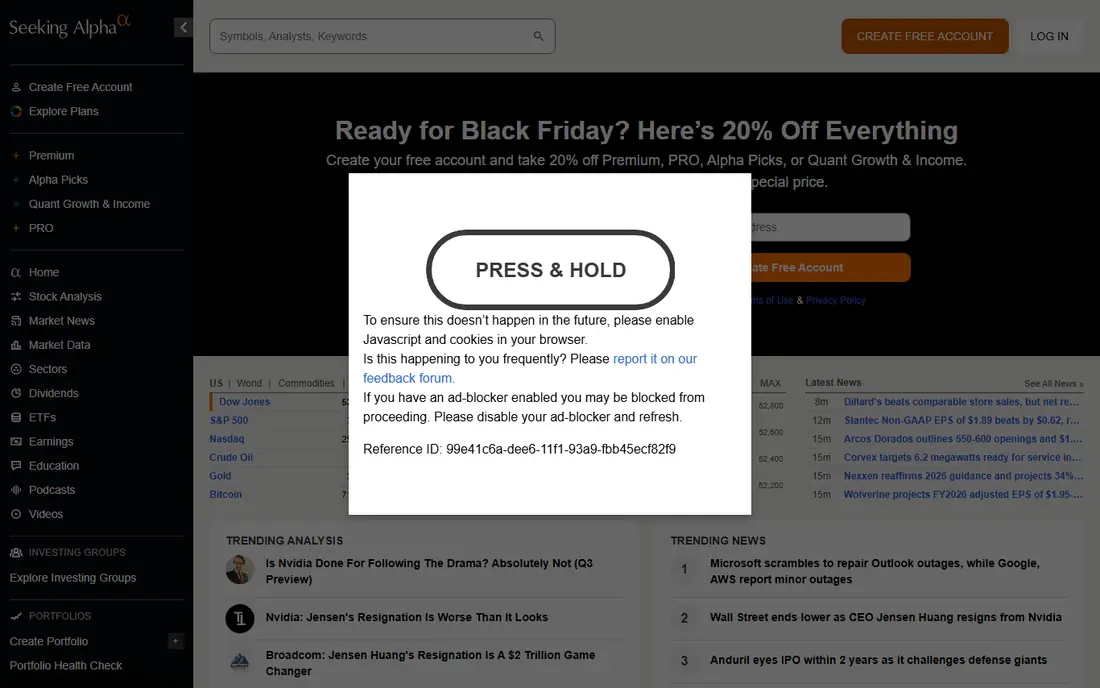
Seeking Alpha pairs tracking with research. Portfolios and watchlists sit beside news, earnings coverage, and analysis from contributors and analysts, with quant ratings summarising valuation, growth, and momentum factors. That combination suits investors who want context behind a price move, not just the quote itself. Alerts cover price moves, earnings, and news for followed tickers.
Article paywalls limit free reading, and contributor quality varies, so readers should weigh author track records and disclosures rather than treating every article equally. Paid tiers give fuller access and premium research features, with pricing on the vendor page. Use Seeking Alpha as a research layer over a tracker such as Yahoo Finance or TradingView, and treat its ratings as one input, not a buy signal.
- Analyst and contributor coverage, quant ratings, portfolio tools, news plus analysis
- Paywall limits full articles, contributor views vary in quality
Morningstar suits investors who research before they buy, especially for funds and dividend stocks. Analyst reports, fair value estimates, and moat ratings give a structured view of quality and valuation, while fund research covers fees, holdings, and manager history in depth. Portfolio tools track holdings and show how a portfolio balances across sectors and styles.
Premium research sits behind a paid plan, and the interface suits longer research sessions better than quick phone checks. Budget-conscious investors often pair Morningstar research with a free tracker for daily quotes. For retirement and long-term investors managing a meaningful portfolio, the analyst reports and fair value context can justify the paid tier, provided the investor actually reads them.
- Analyst reports, fair value estimates, fund research depth, portfolio tools
- Premium research needs a paid plan, interface suits research sessions over quick checks
Investing.com covers a wide range of markets: stocks, indices, commodities, currencies, ETFs, and bonds, with an economic calendar that flags earnings, rate decisions, and data releases. Portfolios and alerts let users follow holdings across countries in one app, which suits investors with global exposure. The free tier covers most tracking needs, with a premium option removing ads and adding features.
Charting is serviceable but trails TradingView for advanced technical work, and ads interrupt free use. Data delays vary by exchange, so active traders should confirm real-time status for their markets. As a global data and calendar companion beside a charting app, Investing.com offers strong breadth for no cost.
- Broad global coverage, economic calendar, alerts and portfolios, free access
- Ads on free tier, chart depth trails TradingView
Stocktwits organises market conversation by ticker, so a user can see what traders and investors are saying about one stock in a single stream. Sentiment snapshots summarise bullish versus bearish chatter, and watchlists plus alerts keep followed tickers in view. That feed can surface news and earnings reactions fast, especially for popular stocks.
Social chatter is not research, and hype, rumours, and pump-style posts appear regularly. Treat Stocktwits as a sentiment check and a news tip feed, then verify any claim in a wire report, company filing, or analyst note before acting. Used with that discipline, it adds a useful social layer to tracking. Used as a sole source, it misleads more than it helps.
- Ticker-based social feed, sentiment snapshots, watchlists and alerts
- Social posts are not research, noise and hype are common
Koyfin presents financial data in clean dashboards, charts, and tables that suit fundamental investors. Financial statements, ratios, estimates, and historical data appear in layouts a user can customise, which helps compare stocks on valuation and growth without juggling spreadsheets. The free tier covers basic tracking and data views, with paid plans adding advanced dashboards and data depth.
Charting for technical analysis is basic compared with TradingView, so active chart readers will still need a second app. Paid pricing starts near $39 per month in commonly listed figures, so check the current vendor page before buying. For investors who think in financials and dashboards rather than indicators, Koyfin offers one of the clearest free starting points.
- Strong data visualisation, dashboards, financial statements and ratios, free tier
- Advanced features need paid plans, charting is basic compared with TradingView
StockCharts
Who it suits: Classic technical charting with a long indicator tradition
StockCharts has served technical investors for years with reliable charts, a wide indicator library, and chart lists that support a routine review habit. A user can build lists by sector, style, or watchlist and scan them daily, which suits systematic chart readers. The free version covers basic charting with ads and limits, while paid plans add saved workspaces, more indicators, and intraday data depth.
The interface feels older than TradingView, and free limits on indicators and saved work prevent a full workflow without payment. Paid plans start near $19.95 per month in commonly listed pricing. For investors who prefer a classic charting workflow and routine list scanning, StockCharts remains a dependable, if less modern, choice.
- Reliable charting, wide indicator library, chart lists for routine review
- Free version limits indicators and saved workspaces, interface feels older
How we picked these
We compared official feature pages, pricing pages, app store listings, and public documentation for apps that track stocks, portfolios, or watchlists with quotes, charts, or research. We favoured apps with current official support, clear free-versus-paid boundaries, and a distinct job, from everyday tracking to charting to research to sentiment. We did not claim hands-on testing. Prices change, and data delays vary by exchange, so the vendor page on the day you sign up is the final source. Nothing in this guide is financial advice.
What to check before you choose
Start with the markets and data you actually follow. Confirm whether quotes are real-time or delayed for your exchanges, and whether the app covers your brokers, funds, or international listings. A tracker that misses a holding or delays a quote will frustrate daily use, however good its charts look.
Next, test alerts and portfolio entry. Add a real portfolio, set price and news alerts, and check how fast they arrive during a busy market day. Note import options from brokers or spreadsheets, because manual entry for many holdings wastes time and invites errors. Check whether the app supports fractional holdings, dividends, and cost basis if those matter to your records.
Finally, separate tracking from decisions. A tracker shows prices and news; it does not tell you what to buy or sell. Build a research routine that pairs a tracker with filings, earnings reports, and independent analysis, and set position rules before market moves test them. If an app pushes trade ideas or social hype, treat those as prompts for research, not as instructions.
Frequently asked questions
Sources we checked (8)

Online Jobs is an independent blog about careers, online work, learning new skills and the tools that help people earn. More about us.
Keep reading
All posts
Best Bill Organizer Apps Free
Compare the best free bill organizer apps in 2026, with bill reminders, due-date tracking, shared budgets and bank sync to help you stop missing payments.

n8n Alternatives
n8n alternatives compared for 2026, with Zapier, Make, Activepieces, and more, covering visual builders, code steps, self-hosting, and pricing models.

eBay Alternatives
Looking for ebay alternatives? We compared 9 marketplaces for sellers on fees, buyer reach, categories and ease of listing, to help you sell with confidence.