Best Search Visibility Analysis Tools in 2026: 9 Tools Compared

How we put this together: we compare official feature and pricing pages, app store listings, privacy policies and public user reviews. Prices change, so check the provider's site before you pay.
Key takeaways
- Analysis tools explain movement, while checking tools only report position, so large sites usually need both types.
- Share of voice shows how much of a market you hold, which is more useful than a single keyword rank.
- Technical problems, content gaps and competitor moves cause most visibility drops, and each needs a different tool view.
- Enterprise platforms often use quote-based pricing, so budget for a sales process and a longer contract.
- AI search results now shape visibility, so analysis should cover AI answers as well as classic search results.
Quick comparison
| Name | Who it suits | Starting price | Free option | |
|---|---|---|---|---|
 BrightEdge | Enterprise share of voice | See website | No | Visit |
 Conductor | Content and audience analysis | See website | No | Visit |
 seoClarity | Data-heavy enterprise analysis | See website | Free trial | Visit |
 Botify | Technical visibility analysis | See website | No | Visit |
 Similarweb | Market and traffic analysis | See website | Free trial | Visit |
 Searchmetrics | Visibility index and market trends | See website | Free trial | Visit |
 Lumar | Large-site technical analysis | See website | Free trial | Visit |
 Sitebulb | Deep technical audits | See website | Free trial | Visit |
 Screaming Frog | Crawl-based technical analysis | See website | Yes | Visit |
The best search visibility analysis tools
Analysis starts where checking stops. Once you know a ranking moved, these tools help you work out whether the cause was content, technology, competition, search features or a change in demand, and what to fix first.
BrightEdge is built for large brands that need to report visibility as market share, not as a list of individual ranks. Its dashboards show how much of a topic or market your site holds, how that share compares with rivals, and which pages drive the change. For a marketing lead who must explain search performance to senior managers, that market view is easier to act on than a long keyword table. The cost and complexity are the trade-offs. Pricing is quoted, contracts tend to be longer, and a team needs time to set up data and learn the reporting. BrightEdge fits an enterprise with many pages and many competitors, not a small site that only needs a weekly rank check.
- Large keyword data set
- Share of voice reporting
- Executive dashboards
- Quote-based pricing
- Setup and training take time
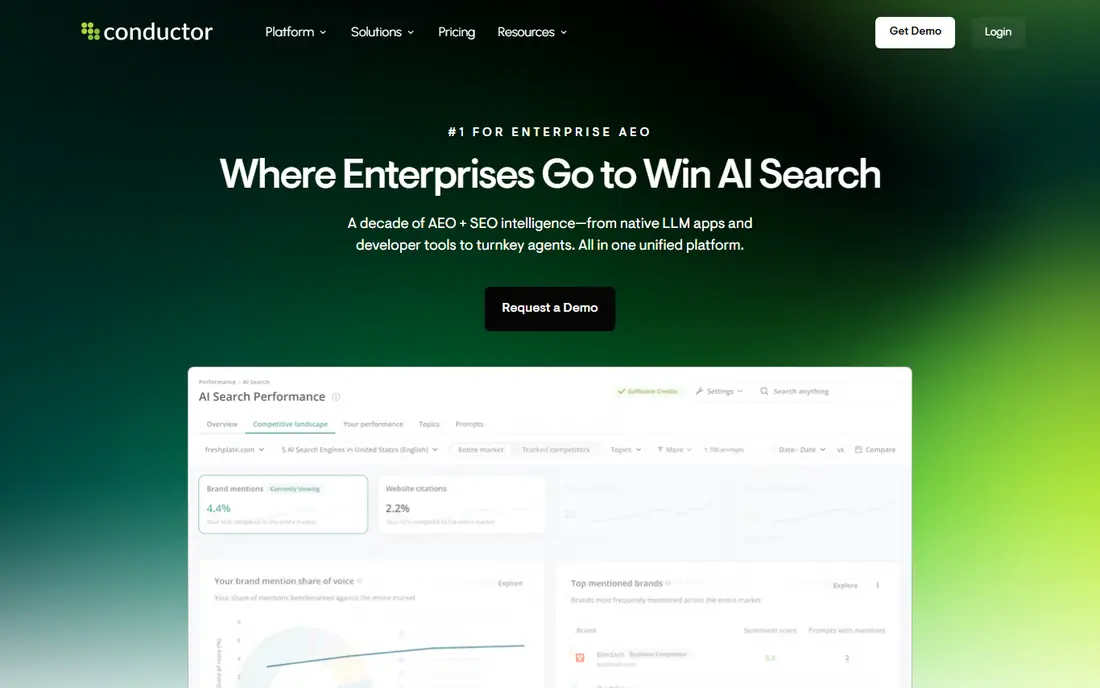
Conductor links visibility to what people are trying to do, not just to the words they typed. Its research tools group queries by intent and topic, which helps a content team see where demand exists and where existing pages fail to meet it. Workflow tools then let teams assign fixes, track content changes and report progress in one place. That focus makes Conductor strong for content-led organisations, but weaker as a cheap standalone checker. A small team with one site may find the platform larger than it needs. A larger team that produces content every week will get more value, because the analysis feeds directly into planning and production.
- Audience and intent research
- Content performance views
- Team workflows
- Quote-based pricing
- Less suited to a single small site
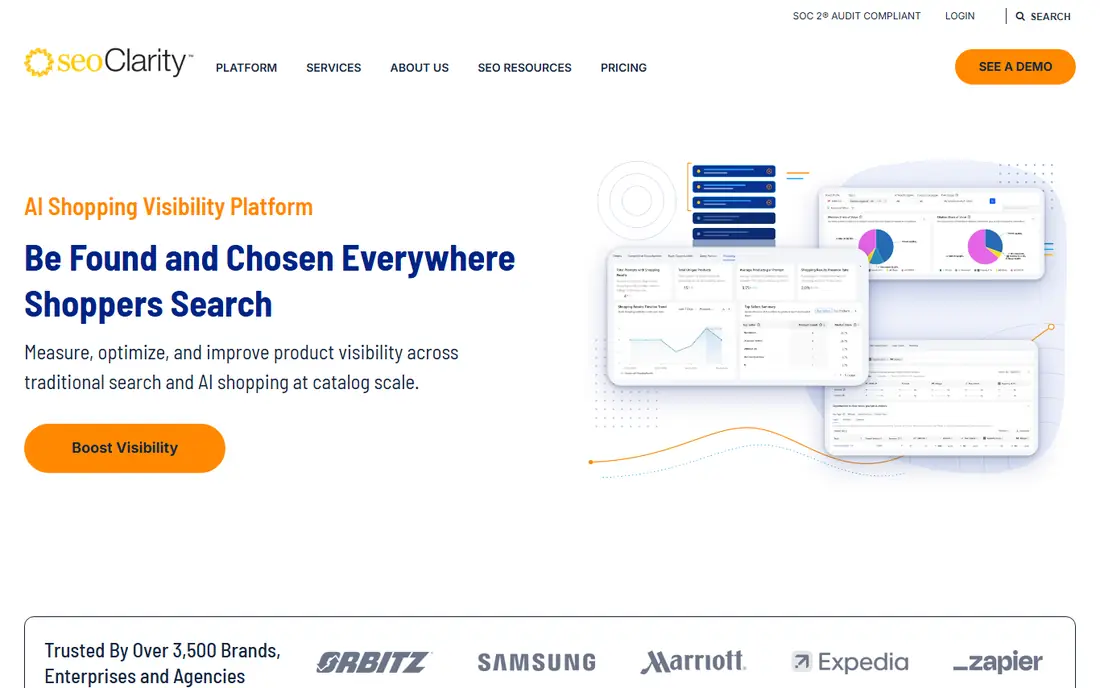
seoClarity suits teams that work with very large keyword sets and need to slice visibility by page type, location, device and search feature. Its analysis tools connect rankings, traffic estimates and content performance, so a drop can be traced to a page group rather than guessed at from a single keyword. AI search tracking adds a view of how a brand appears in AI answers, which is now part of visibility for many queries. Complexity is the price of that depth. New users need training, and costs rise with keyword and page volume. seoClarity is best for technical and data-led teams that will use its filters and reports every week, not for occasional checks.
- Very large data sets
- AI search visibility tracking
- Detailed rank and content analysis
- Complex setup
- Pricing varies by data volume
Botify answers a question other analysis tools often miss: which pages can search engines actually crawl, render and index, and how does that affect traffic. It combines crawl data with log files to show wasted crawl budget, orphan pages and rendering problems. For a large ecommerce or publishing site, those issues can quietly reduce visibility even when content is strong. Botify is not a beginner tool. It needs technical staff who can read crawl and log data and act on it. Smaller sites with a few hundred pages will usually get enough technical insight from a cheaper crawler. Large sites with millions of pages are where Botify earns its cost.
- Log and crawl analysis
- JavaScript rendering
- Links technical issues to traffic impact
- Quote-based pricing
- Needs technical skill to use well
Similarweb widens the view beyond search alone. It estimates total traffic, traffic sources and audience behaviour for competitors, which helps explain whether a visibility drop is a search problem or part of a wider market shift. A site that lost search share but gained direct or social traffic looks very different from a site that lost traffic everywhere. The figures are estimates based on panels and models, so they should not be treated as exact counts. Use Similarweb for market context and direction, and use Search Console for exact clicks on your own site. That pairing gives both the market story and the verified site data.
- Whole-market traffic estimates
- Competitor channel mix
- Audience insights
- Traffic figures are modelled, not exact
- Detailed plans are costly
Searchmetrics is known for its visibility index, which turns many keyword positions into one trend line for a domain. That single line makes it easy to see whether a site is gaining or losing ground over months, and to compare that trend with rivals in the same market. Content analysis then helps link a trend to specific page groups or topics. The platform is less transparent on pricing than some rivals, so buyers should expect a sales conversation. It also suits analysts who are comfortable with index-based reporting. For a team that wants a clear market trend plus content insight, Searchmetrics remains a useful analysis option.
- Long-running visibility index
- Market and competitor trends
- Content analysis
- Pricing is not fully public
- Interface can feel dated to new users
Lumar, formerly DeepCrawl, focuses on technical health for large websites. It crawls at scale, scores site health, and groups issues by impact so technical teams can fix the problems that affect visibility first. Broken links, redirect chains, duplicate content and indexation gaps are shown in a form that a developer can act on. Lumar does not try to be a content planning tool, so it pairs best with a research or content platform. For a large site, that split works well: Lumar finds and prioritises technical causes, while another tool handles keyword and content analysis. Small sites may find a desktop crawler enough.
- Deep technical crawling at scale
- Site health scoring
- Clear issue prioritisation
- Cost rises with site size
- Mainly technical, not content planning
Sitebulb turns a technical audit into a visual report that non-developers can follow. It explains each issue, shows which pages are affected, and ranks fixes by priority. That clarity helps when an audit must be shared with managers, clients or developers who were not involved in the crawl. As desktop software, Sitebulb needs a capable machine for very large crawls, and it does not track rankings over time. Use it for periodic deep audits and for explaining technical causes, and use a rank tracker or enterprise platform for ongoing visibility trends. That combination covers both depth and continuity.
- Visual audit reports
- Clear issue explanations
- Desktop crawling for large audits
- Desktop software needs local resources
- Not a rank tracker
Screaming Frog is a desktop crawler that many technical SEOs use as a first step in analysis. It lists URLs, status codes, titles, meta data, headings and links, and lets you export the data for further work. For a small or mid-size site, the free version can already reveal missing titles, broken links and redirect problems that affect visibility. The output is raw, so it suits users who know what to look for. A beginner may need guidance to turn a crawl into a fix list. Screaming Frog is best seen as a precise technical lens: it shows what is on the site, while other tools in this list show how that site performs in search and in the wider market.
- Fast, flexible crawling
- Free version for small sites
- Strong export options
- Raw data needs skill to interpret
- Paid licence needed for large crawls
How we picked these
We compared official feature pages, pricing pages, app store listings, privacy policies and public reviews, with a focus on analysis rather than simple position reporting. We looked for share of voice, market comparison, content gap views, technical crawl and log analysis, and AI search coverage. We favoured tools that let a team trace a change to a cause, not just report that a change happened. We did not claim hands-on testing. Where pricing was quote-based, we wrote See website rather than repeating third-party estimates as fact. That choice keeps the comparison honest for enterprise tools, where the final price depends on keyword volume, page count and contract length.
How to use analysis without drowning in data
Start from a business question
A useful analysis starts with a question such as which product group lost visibility, or whether a rival gained share after a content launch. That question decides which report to open. Without it, a dashboard full of charts can take hours and still give no decision.
Separate cause from noise
Check three causes in order: technical issues, content gaps and competitor moves. A technical crawl can rule out indexation or rendering problems. Content analysis can show whether rivals now answer the query better. Market data can show whether demand itself fell. Working in that order stops a team from rewriting pages when the real problem was a crawl block.
Report share, not just ranks
A single keyword can rise while overall share falls, if rivals gain on many other terms. Report share of voice for a topic group, plus clicks from Search Console, to give a fuller picture. That view also helps managers see why a small rank change matters, or why it does not.
Frequently asked questions
What is the best search visibility analysis tool for a large site?
BrightEdge, Conductor and seoClarity are common enterprise choices, while Botify and Lumar suit large technical sites. The right pick depends on whether the main need is market share, content planning or technical health. Most large sites pair one enterprise platform with a crawler.
What is the difference between checking and analysis tools?
Checking tools report where you rank for a chosen list of terms. Analysis tools explain why visibility changed, by linking ranks to content, technical issues, competitors and market trends. Checking answers what happened, while analysis answers why it happened and what to fix.
Do I need an enterprise tool for a small site?
Usually not. A small site can analyse visibility with Search Console, a rank tracker and a desktop crawler such as Screaming Frog or Sitebulb. Enterprise tools become useful when page counts, keyword counts or competitor sets grow beyond what those tools can handle cleanly.
How does AI search affect visibility analysis?
AI answers can satisfy a query without a click, so classic rank and click data may understate brand exposure. Analysis tools that track AI mentions and citations help show whether a brand appears in answers, even when clicks fall. Check both classic and AI views before judging performance.
Why does share of voice matter more than one ranking?
Share of voice covers a whole topic or market, so it shows whether you are gaining or losing ground overall. One keyword can be volatile and may not reflect real traffic. A topic-level share view is harder to misread and easier to link to business results.
Are traffic estimates from analysis tools exact?
No, most competitor traffic figures are modelled estimates, not exact counts. Use them for comparison and direction, and use Search Console for exact clicks and impressions on your own site. A large gap between an estimate and your own data is a reason to check the method, not to ignore either source.
Sources we checked (9)

Online Jobs is an independent blog about careers, online work, learning new skills and the tools that help people earn. More about us.
Keep reading
All posts
n8n Alternatives
n8n alternatives compared for 2026, with Zapier, Make, Activepieces, and more, covering visual builders, code steps, self-hosting, and pricing models.
ZoomInfo Alternatives
The best ZoomInfo alternatives in 2026, compared on price, free plans, data coverage, and which tool fits small teams or large sales teams best in detail.
Workday Alternatives
We compared the best workday alternatives for HR, payroll, and global hiring, from BambooHR and Gusto to Rippling, Deel, and HiBob for growing teams in 2026.