Best Mobile App Analytics in 2026: 8 Tools Compared


Free analytics for mobile teams · Starting price: Free
How we put this together: we compare official feature and pricing pages, app store listings, privacy policies and public user reviews. Prices change, so check the provider's site before you pay.
Key takeaways
- Firebase Analytics is the free foundation for most mobile teams, with unlimited event reporting at no cost.
- Mixpanel and Amplitude lead on product funnels and retention, with generous free tiers that suit early-stage apps.
- PostHog bundles analytics with replays, flags, and experiments, which replaces several tools for product-led teams.
- AppsFlyer and Adjust answer attribution questions about which campaign drove installs, and they usually sit alongside a product tool rather than replacing it.
Quick comparison
| Name | Who it suits | Starting price | Free option | |
|---|---|---|---|---|
| Firebase Analytics | Free analytics for mobile teams | Free | Yes | Visit |
 Mixpanel | Event funnels and retention | Free | Yes | Visit |
 Amplitude | Behavioral analytics at scale | Free | Yes | Visit |
 PostHog | Analytics plus replays and flags | Free | Yes | Visit |
 UXCam | Session replay for mobile UX | Free | Yes | Visit |
 Smartlook | Visual behavior analytics | See website | Yes | Visit |
 AppsFlyer | Mobile attribution | See website | Yes | Visit |
 Adjust | Attribution with automation | See website | No | Visit |
The best mobile app analytics
Mobile app analytics answers three questions: what users do in the app, why they leave, and which campaigns brought them in the first place. Product tools answer the first two, replay tools explain the why, and attribution tools answer the third. Most serious apps run one of each.
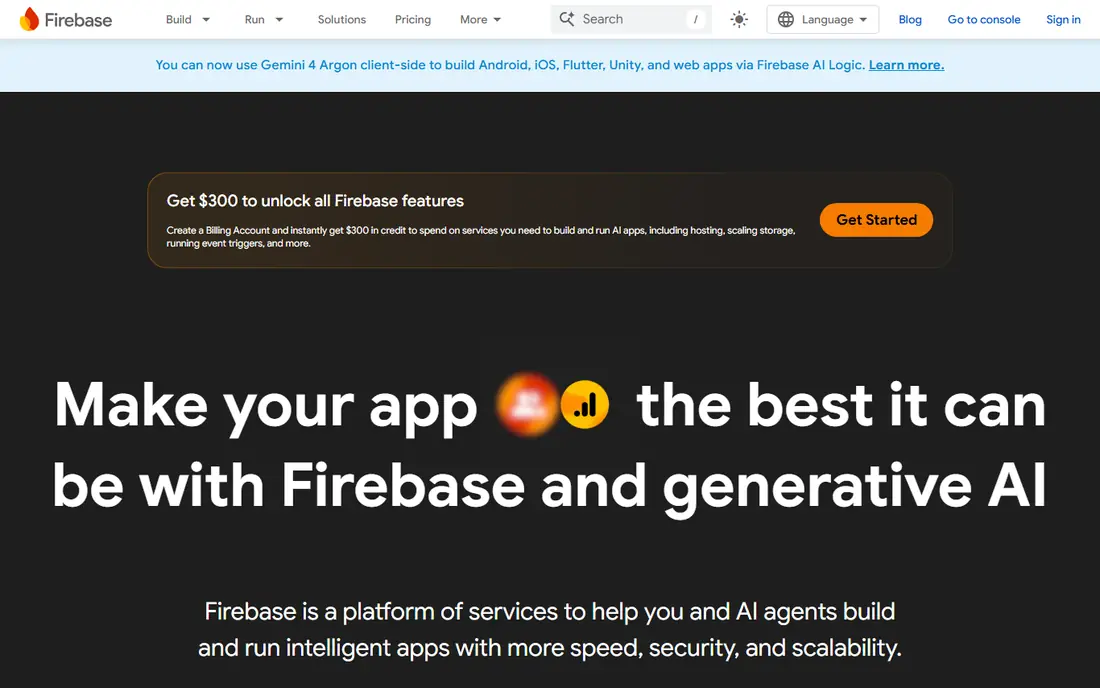
Firebase Analytics, part of Google Firebase, is the default free analytics layer for Android and iOS apps. It reports events, audiences, funnels, and retention at no cost and without an event-volume cap, which makes it the safest starting point for any mobile team. Integration with Google Ads, Crashlytics, and Remote Config keeps the whole stack in one place.
The trade-off is depth. Firebase shows trends well but offers less granular user-level analysis than dedicated product tools, so growth teams often add Mixpanel or Amplitude later. For a first app or a tight budget, Firebase alone covers the essentials.
- Free with no event-volume cap
- Up to 500 distinct event types
- Deep Google integration
- Less user-level depth than Mixpanel or Amplitude
- Reporting is higher level
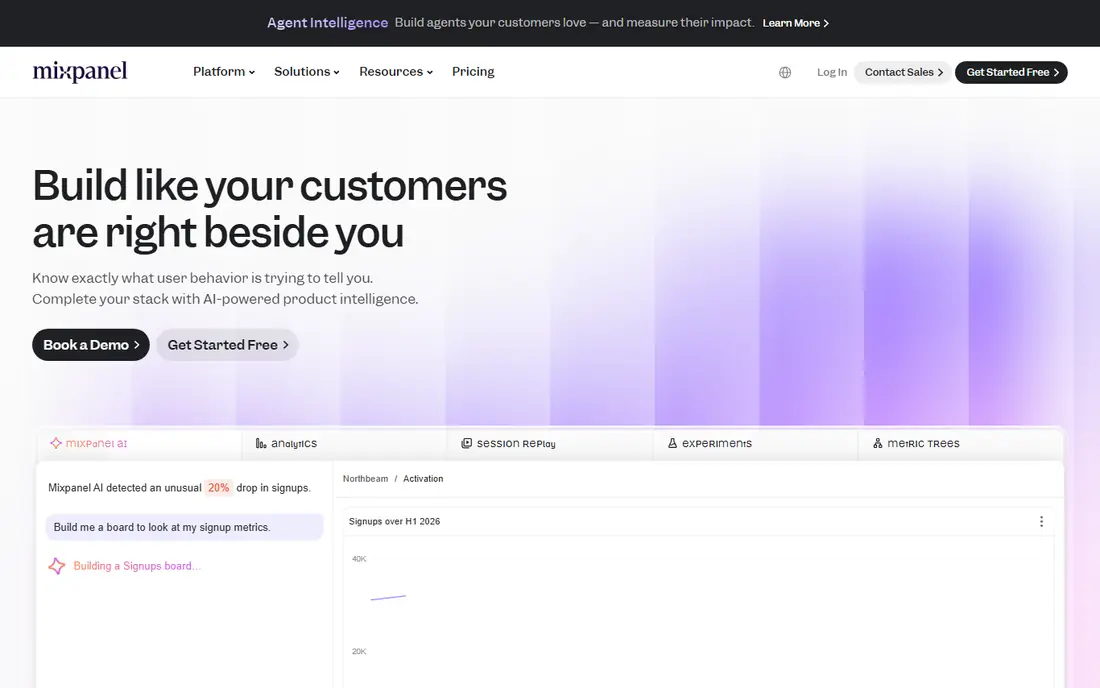
Mixpanel is the product analytics pick for mobile teams that need to understand funnels and retention in detail. Teams can build funnels without writing queries, compare cohorts, and watch retention curves change after each release. The free plan covers 1 million events per month, with usage-based Growth pricing beyond that.
Event volume pricing means teams should plan which events matter and avoid tracking everything by default. With disciplined instrumentation, Mixpanel gives a small team the same funnel visibility that larger companies pay far more for.
- Free for up to 1 million events per month
- Strongest self-serve funnel builder
- Real-time reports
- Usage-based pricing grows with volume
- Manual instrumentation takes planning
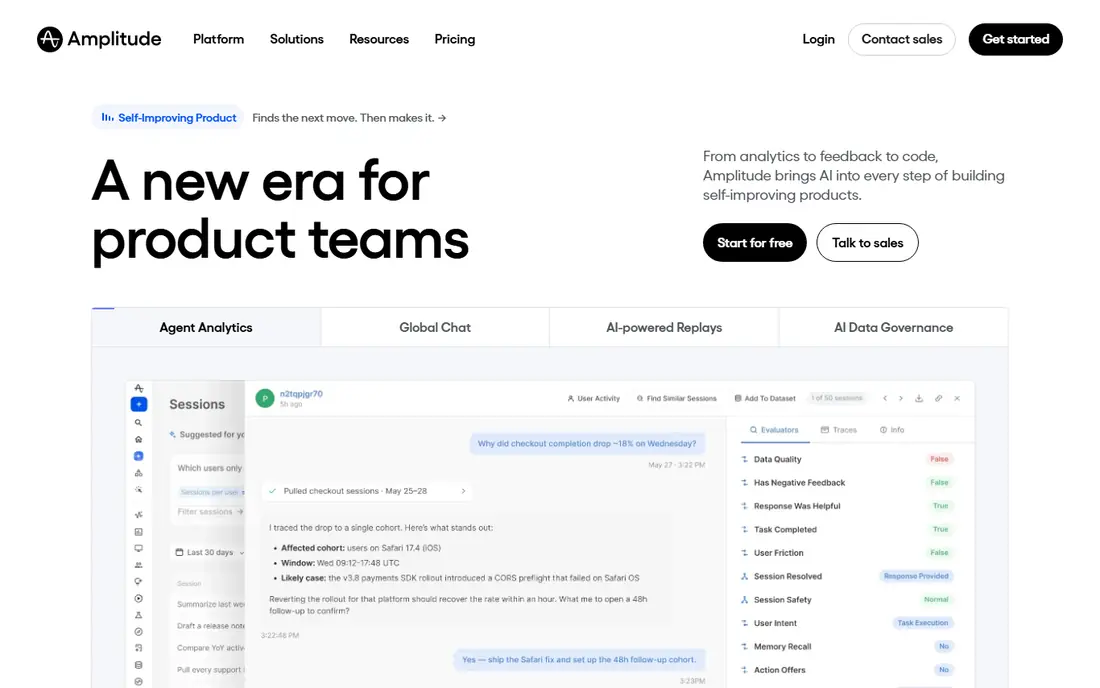
Amplitude is the enterprise-leaning product analytics platform, with behavioral cohorts, predictive modeling, and experimentation built around event data. Its free tier is generous, and paid plans scale by usage, which gives growing apps room before costs arrive. Large teams value its governance, data quality tools, and cross-platform reporting.
The interface carries a learning curve, and higher-tier pricing is not published as a simple rate card. For apps with the team to use its depth, Amplitude is the most powerful product analytics tool on this list.
- Generous free tier
- Behavioral cohorts and predictive features
- Experimentation tools
- Paid pricing is quote-based at higher tiers
- Interface can overwhelm new users
PostHog bundles product analytics with session replays, feature flags, surveys, and experiments, which lets a mobile team replace several separate tools. The free tier covers 1 million events per month plus replays and other products, and self-hosting is possible for teams that want data control. Mobile SDKs cover iOS, Android, and cross-platform frameworks.
Breadth is the risk as well as the appeal, since teams that only need analytics may find the extra products distracting. For product-led teams that want one platform for measurement and experimentation, PostHog is the most complete free starting point.
- Analytics, replays, feature flags, surveys, and experiments in one tool
- Open-source option
- Generous free tier
- Broad scope can feel sprawling
- Usage pricing needs monitoring across products
UXCam shows exactly how users experience an app, with session replays, heatmaps, and gesture tracking built for mobile screens. Rage taps, frustrated gestures, and crash sessions surface the moments where users give up, which funnel charts alone cannot explain. A free tier covers 3,000 sessions per month, with paid plans for higher volume.
UXCam is a companion to a product tool, not a replacement, since its funnel and retention reporting is thinner than Mixpanel or Amplitude. Pair it with Firebase or Mixpanel to see both what happens and why.
- Mobile-first session replay
- Gesture and rage-tap capture
- Free tier with 3,000 sessions per month
- Not a full product analytics replacement
- Paid pricing is quote-based
Smartlook combines session recordings, heatmaps, funnels, and event tracking for websites and mobile apps in one dashboard. Teams that run both a marketing site and an app can watch behavior across both without switching tools, and a free plan lets small teams start without paying.
Paid pricing is not listed as a single entry rate, so budget-conscious teams should request a quote early. For visual behavior analysis across web and mobile, Smartlook is a practical alternative to UXCam, especially for teams that also need website replays.
- Session recordings and heatmaps for web and mobile
- Funnels and events included
- Free plan available
- Pricing not published as a simple entry rate
- Mobile depth is thinner than UXCam
AppsFlyer answers the marketing question that product tools cannot: which campaign, channel, or creative drove each install and purchase. It supports SKAdNetwork and privacy-safe measurement, deep linking, and return-on-ad-spend reporting across major ad networks. A free tier covers limited conversions, with paid pricing per conversion beyond that.
Attribution tools do not replace product analytics, since they track acquisition rather than in-app behavior. Apps that spend on paid acquisition usually run AppsFlyer alongside Firebase or Mixpanel, using each tool for the question it answers best.
- Strong SKAdNetwork and privacy-safe attribution
- Deep links
- ROAS reporting
- Large ad network integrations
- Custom pricing
- Limited product analytics depth
Adjust combines mobile attribution with automation, fraud prevention, and analytics for larger advertisers. It measures campaigns across channels, automates reporting and budget decisions, and flags suspicious install activity that would otherwise waste ad spend. Enterprise reporting and integrations suit teams running many campaigns at once.
There is no free plan, and pricing is custom, which puts Adjust out of reach for indie apps. For funded startups and enterprises with serious paid acquisition, Adjust is a strong alternative to AppsFlyer with deeper automation.
- Attribution plus automation and fraud prevention
- Strong enterprise reporting
- Broad integrations
- No free plan
- Custom pricing suits larger advertisers
How we picked these
We compared vendor pricing pages, free tiers, mobile SDK coverage, and the job each tool serves, from product analytics to replay and attribution. We included free foundations, product leaders, replay specialists, and attribution platforms because a complete mobile stack usually needs more than one tool. Prices reflect vendor pages or recent pricing checks, and tools without published entry rates are marked See website.
How to choose a mobile analytics stack
Start free, then add depth where questions go unanswered
Firebase covers the basics at no cost, so add Mixpanel or Amplitude only when funnel and retention questions outgrow Firebase reporting. Add UXCam when you need to see why users drop off, and add attribution only when paid campaigns need measurement.
Plan events before you instrument
Tracking everything creates noisy data and larger bills on usage-priced tools. List the key actions for your app, such as signup, first purchase, and core feature use, and instrument those first. You can always add events later, but cleaning up bad data is harder.
Respect privacy rules from the start
Mobile privacy rules, including Apple App Tracking Transparency, limit cross-app tracking but do not stop first-party product analytics. Choose tools with clear consent handling, avoid collecting identifiers you do not need, and review each SDK data collection before release.
Frequently asked questions
What is the best mobile app analytics tool overall?
Firebase Analytics is the best free starting point for most apps, while Mixpanel is the best product analytics tool for funnels and retention. Teams that need both acquisition and behavior data should pair Firebase or Mixpanel with an attribution tool such as AppsFlyer.
What is the best mobile analytics tool for apps on a budget?
Firebase Analytics is free with no event cap, and Mixpanel, Amplitude, and PostHog all offer generous free tiers for early-stage apps. Start with Firebase plus one product tool, and only pay when event volume or team needs outgrow the free tiers.
What is the best mobile app analytics platform for funnels?
Mixpanel offers the strongest self-serve funnel builder for mobile teams, with Amplitude close behind on behavioral cohorts and predictive features. PostHog is the best all-in-one alternative when funnels, replays, and experiments need to live in one tool.
Do I need attribution and product analytics together?
Yes, if you run paid campaigns. Attribution tools such as AppsFlyer and Adjust show which campaigns drove installs, while product tools such as Mixpanel and Amplitude show what those users did after installing. Organic-only apps can often skip attribution until paid growth begins.
How does App Tracking Transparency affect mobile analytics?
App Tracking Transparency restricts tracking users across other apps, but it does not stop first-party measurement of your own app. Product analytics built on your own event data remain reliable, while ad attribution now relies more on aggregated and privacy-safe methods such as SKAdNetwork.
Sources we checked (8)

Online Jobs is an independent blog about careers, online work, learning new skills and the tools that help people earn. More about us.
Keep reading
All posts
ZoomInfo Alternatives
The best ZoomInfo alternatives in 2026, compared on price, free plans, data coverage, and which tool fits small teams or large sales teams best in detail.

Workday Alternatives
We compared the best workday alternatives for HR, payroll, and global hiring, from BambooHR and Gusto to Rippling, Deel, and HiBob for growing teams in 2026.
Which SaaS Tools Have the Best Customer Support
Which SaaS tools have the best customer support? Compare eight popular tools on help centres, live help, response options and overall support quality.