Best Data and Reporting Tools in 2026: 8 Tools Compared

How we put this together: we compare official feature and pricing pages, app store listings, privacy policies and public user reviews. Prices change, so check the provider's site before you pay.
Key takeaways
- The best reporting tool depends on where your data lives: Google, Microsoft, or many different systems.
- Looker Studio is our pick for Google-based teams, because the core product is free and setup is fast.
- Power BI is our pick for Microsoft-based teams, because its per-user price is low for what it offers.
- Tableau suits teams that need polished, interactive dashboards and have the budget and skills to build them.
Quick comparison
| Name | Who it suits | Starting price | Free option | |
|---|---|---|---|---|
 Looker Studio | Google-based reporting | Free | Yes | Visit |
 Power BI | Microsoft-based teams | $14 per user per month | Yes | Visit |
 Tableau | Polished visual dashboards | $75 per user per month | Free trial | Visit |
 Zoho Analytics | Budget reporting for small teams | See website | Yes | Visit |
 Qlik Sense | Deep data exploration | See website | Free trial | Visit |
 ThoughtSpot | Search-based analytics | See website | Free trial | Visit |
 Metabase | Simple self-service reporting | See website | Yes | Visit |
 Domo | Executive dashboards at scale | See website | No | Visit |
The best data and reporting tools
A reporting tool turns raw data into a dashboard, chart, or scheduled report that a manager can actually use. Some tools focus on beautiful visuals, some on asking questions in plain language, and some on connecting many sources with little code. The eight tools below cover those needs, from free Google reporting to enterprise dashboards, and each one fits a different team.
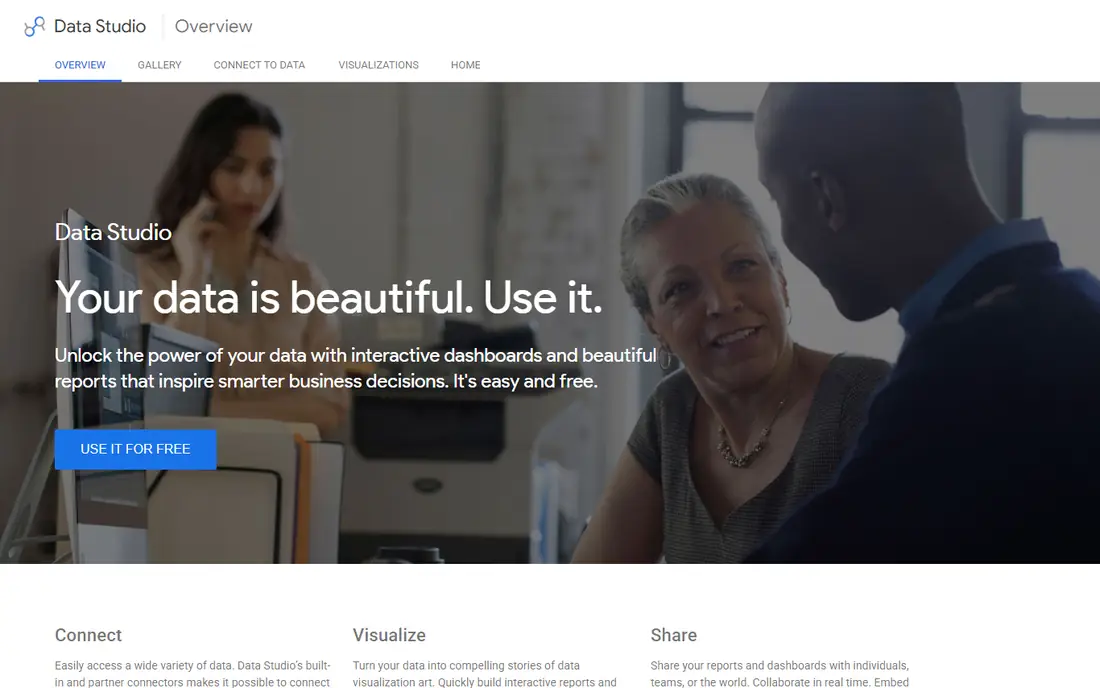
Looker Studio is the easiest reporting tool to start with if your data already lives in Google Analytics, Google Ads, Search Console, Sheets, or BigQuery. You can build a dashboard by dragging fields onto a canvas, share it by link, and schedule email delivery without buying a licence. For marketing reports, client reports, and small-team dashboards, that free entry point is hard to beat.
The limits appear at scale. Governance, ownership, and advanced modelling are thinner than in Power BI or Tableau, and very large datasets can slow reports. Looker Studio Pro, priced per user per project, adds team features for larger use. If your team is Google-based and your reports are mainly marketing and web data, start here before paying for anything else.
- Free core product
- Native Google Analytics, Ads, and Sheets links
- Easy sharing
- Limited governance at scale
- Fewer advanced visuals than Tableau
- Pro features cost extra
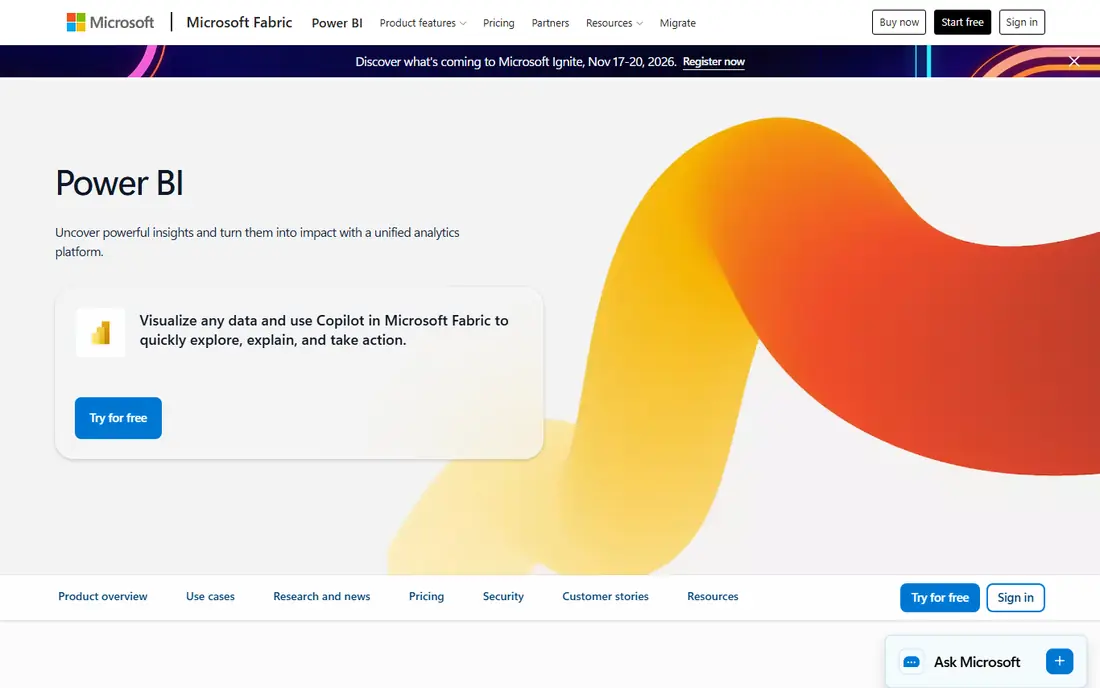
Power BI is the default reporting tool for teams that already run Microsoft 365, Excel, and Azure. Its Pro licence, at $14 per user per month when paid yearly, lets you publish and share reports, and its data modelling tools handle calculations that a spreadsheet cannot. With hundreds of connectors, it can pull data from databases, cloud apps, and files into one dashboard.
The catch is licensing for viewers. In many setups, every report viewer needs a Pro licence, or the company needs a capacity plan, so the total cost depends on audience size, not just creators. DAX, its formula language, also takes time to learn for complex metrics. Still, for Microsoft teams, Power BI offers the best capability per dollar in this list.
- Low per-user price for enterprise features
- Strong Excel and Azure links
- Large connector library
- Viewers need licences in many setups
- DAX modelling has a learning curve
- Sharing rules can confuse
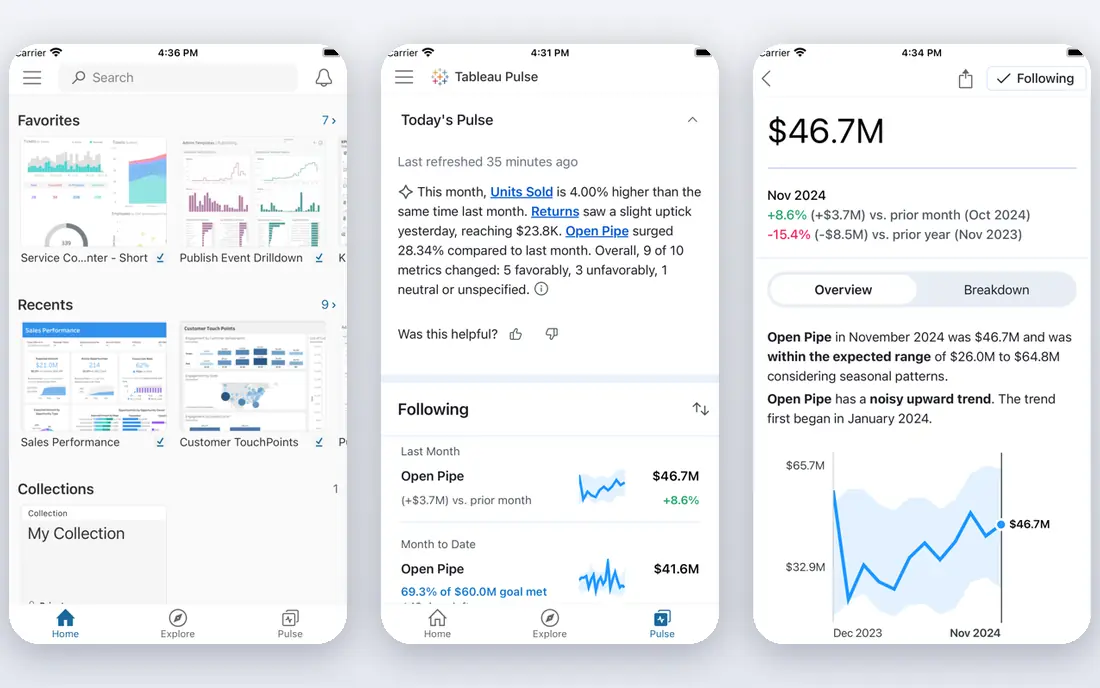
Tableau is known for visual quality: its charts are polished, its interactive filters feel smooth, and its dashboards suit boardrooms and client presentations. Analysts can explore data freely, drill into details, and tell a story with a dashboard rather than just showing a table. For teams where presentation matters as much as accuracy, Tableau remains the benchmark.
That quality costs money and skill. The Creator licence, at $75 per user per month when billed annually, is among the highest per-user prices here, and complex dashboards take a skilled builder. Viewer and Explorer licences cost less, but the total still adds up for a large audience. Choose Tableau when visual impact and deep exploration justify the budget.
- Best-in-class visual design
- Strong interactive exploration
- Large community and resources
- Creator price is high
- Needs skilled builders for complex dashboards
- Enterprise costs add up
Zoho Analytics suits small businesses that need real dashboards without an enterprise budget. It connects to spreadsheets, databases, and cloud apps, offers a free tier, and includes an AI assistant that can answer simple questions about your data. For a team already using Zoho CRM or Zoho Books, reports can draw on that data directly.
Zoho Analytics is less suited to very large datasets or complex enterprise governance, where Power BI or Tableau pull ahead. Check the current pricing page for row and user limits on your plan, since those limits decide whether a low price stays low. For a small team that wants dashboards this week, Zoho Analytics is a practical pick.
- Low cost
- Broad connectors
- AI assistant for questions
- Good Zoho suite links
- Performance can dip on very large datasets
- Fewer enterprise features than Power BI
Qlik Sense is built for exploration: its associative engine lets users click a value and see how every other chart and table relates to that choice, including values that are excluded. That makes it powerful for analysts who need to follow a hunch through complex data, rather than just read a fixed dashboard. It suits finance, operations, and supply chain teams with many linked tables.
The learning curve is real, both for builders and for users who expect a simple dashboard. Pricing for larger deployments is quoted, so get a figure for your user count and data size before comparing it with Power BI. If your team values exploration over fixed reports, Qlik Sense deserves a trial.
- Associative engine for free-form exploration
- Strong for complex data relationships
- Good mobile apps
- Learning curve for builders
- Enterprise pricing is quote-based
ThoughtSpot lets business users type a question, such as sales by region last quarter, and get a chart answer without writing SQL. That search style suits managers who want answers on demand, rather than waiting for an analyst to build a dashboard. Its AI features can also suggest follow-up questions and explain changes in a metric.
ThoughtSpot still needs clean, well-modelled data to give trustworthy answers, so data preparation work comes first. Lower tiers also limit AI queries, so check those caps against how often your team will ask questions. If your bottleneck is analyst time, not data access, ThoughtSpot can unblock a whole team.
- Ask questions in plain language
- AI-assisted answers
- Good for business users without SQL
- Lower tiers limit AI queries
- Setup needs clean, modelled data
Metabase is the friendly self-service option for teams that know some SQL but do not want a heavy enterprise tool. Its question builder lets non-technical users build charts without code, while SQL users can write custom queries. An open-source version can be self-hosted, and a cloud version removes that setup work. Embedding dashboards into an internal app is also straightforward.
Metabase is less polished than Tableau for executive presentations, and its cloud pricing depends on usage, so check the current page for your scale. For startups, internal tools teams, and data teams that want a quick, honest reporting layer, Metabase is a strong, low-friction choice.
- Open-source option
- Simple question builder
- Easy to embed
- Good for SQL-fluent teams
- Fewer advanced visuals than Tableau
- Cloud pricing rises with usage
- Needs setup for large use
Domo is an all-in-one cloud platform that combines connectors, data preparation, and dashboards, with a focus on executive and company-wide reporting. It suits larger companies that want one platform for many departments, rather than a patchwork of tools. Its mobile apps and alerting also help leaders check key metrics without opening a laptop.
Domo pricing is quoted, and its credit-based model means costs can climb with usage, so larger companies should model a realistic workload before signing. For a small team, Domo is likely more platform than needed. For a company that wants governed, company-wide dashboards with strong support, Domo earns a place on the shortlist.
- All-in-one cloud platform
- Strong connectors and data prep
- Executive-friendly dashboards
- Quote-based pricing
- Credit-based costs can climb
- Best suited to larger companies
How we picked these
We compared official feature pages, pricing pages, and trial terms for reporting tools that build dashboards and scheduled reports from live data, not just spreadsheets. We favoured tools with a free tier, trial, or published starting price, and we left out pure data warehouses and pure spreadsheet tools. Where pricing is quoted or usage-based, we use See website, and we note licensing traps, such as viewer licences, where they affect the real cost.
How to choose the right tool
Start with your data sources and your audience. If your data lives in Google tools and your audience is small, Looker Studio is enough. If your data lives in Microsoft tools, Power BI is the natural fit. If your audience needs polished, interactive exploration and you have skilled builders, Tableau is worth its price.
Data quality comes first
A dashboard built on messy, duplicate, or outdated data will mislead faster than no dashboard at all. Before buying, check who owns each source, how often it refreshes, and how you will handle definitions, such as what counts as an active customer. A reporting tool cannot fix a definition argument.
Try with a real report
Build one real report, with real data, for a real decision, during the trial. Check refresh speed, mobile viewing, sharing permissions, and scheduled delivery. A tool that looks good in a demo but fails on your data, your audience size, or your sharing rules is the wrong tool, however strong its feature list looks.
Frequently asked questions
What are the best data reporting tools for small businesses?
Looker Studio and Zoho Analytics are the best small-business starting points, because both offer free tiers and quick setup. Metabase suits teams with some SQL skills that want self-service reporting. Power BI becomes the better pick once a team runs on Microsoft 365 and needs to share reports widely.
Is Power BI better than Tableau?
Power BI is better for value and for Microsoft-based teams, with a lower per-user price and strong Excel links. Tableau is better for visual polish and deep interactive exploration, if you have the budget and skilled builders. Many companies use Power BI for broad reporting and Tableau for a smaller set of executive dashboards.
Can I build reports for free?
Yes. Looker Studio is free for core reporting, Zoho Analytics offers a free tier, and Metabase offers an open-source version. Free tiers usually limit users, rows, or advanced features, so check those limits against your data size. For a small team with Google or spreadsheet data, free reporting can cover most needs.
What is the difference between reporting and business intelligence?
Reporting usually means scheduled dashboards and charts that track known metrics, while business intelligence adds exploration, modelling, and ad-hoc questions. In practice, most tools in this list do both, with different strengths. Looker Studio leans toward reporting, ThoughtSpot leans toward ad-hoc questions, and Power BI and Tableau cover both.
Which tool is best for marketing reports?
Looker Studio is the best pick for marketing reports when data lives in Google Analytics, Google Ads, and Search Console, since those links are native and free. Power BI suits marketing teams on Microsoft tools, while Domo suits larger companies that need marketing data combined with sales and finance data in one executive view.
Sources we checked (8)

Online Jobs is an independent blog about careers, online work, learning new skills and the tools that help people earn. More about us.
Keep reading
All posts
ZoomInfo Alternatives
The best ZoomInfo alternatives in 2026, compared on price, free plans, data coverage, and which tool fits small teams or large sales teams best in detail.

Workday Alternatives
We compared the best workday alternatives for HR, payroll, and global hiring, from BambooHR and Gusto to Rippling, Deel, and HiBob for growing teams in 2026.
Which SaaS Tools Have the Best Customer Support
Which SaaS tools have the best customer support? Compare eight popular tools on help centres, live help, response options and overall support quality.