Best Benchmark Software in 2026: 9 Tools Compared

How we put this together: we compare official feature and pricing pages, app store listings, privacy policies and public user reviews. Prices change, so check the provider's site before you pay.
Key takeaways
- Geekbench is the best all round CPU and system benchmark for comparing phones, laptops, and desktops on a common scale.
- Cinebench suits CPU rendering tests, while 3DMark suits gaming graphics tests, and each one answers a different performance question.
- PCMark 10 and PassMark PerformanceTest give a broader system score, useful when you want one number for everyday and office work.
- CrystalDiskMark, FurMark, and Blender Benchmark test one part in depth, namely storage, graphics stability, and rendering.
- Run a benchmark more than once, on a cool machine with background apps closed, because a single score can mislead.
Quick comparison
| Name | Who it suits | Starting price | Free option | |
|---|---|---|---|---|
 Geekbench | CPU and system comparison | See website | Free trial | Visit |
 Cinebench | CPU rendering performance | Free | Yes | Visit |
 3DMark | Gaming graphics performance | See website | Free trial | Visit |
 PCMark 10 | Everyday system performance | See website | Free trial | Visit |
 PassMark PerformanceTest | Full system scoring | See website | Free trial | Visit |
 CrystalDiskMark | Disk speed testing | Free | Yes | Visit |
 FurMark | GPU stress testing | Free | Yes | Visit |
 Blender Benchmark | 3D rendering comparison | Free | Yes | Visit |
 Novabench | Quick free system score | Free | Yes | Visit |
The best benchmark software
Benchmark software measures how fast a computer performs a task, from rendering an image to loading a game level. No single score tells the whole story, because a fast CPU can sit beside a slow disk or a weak graphics card. We compared nine tools that are still active in October 2026, looking at what each one tests, how results compare, and what it costs.
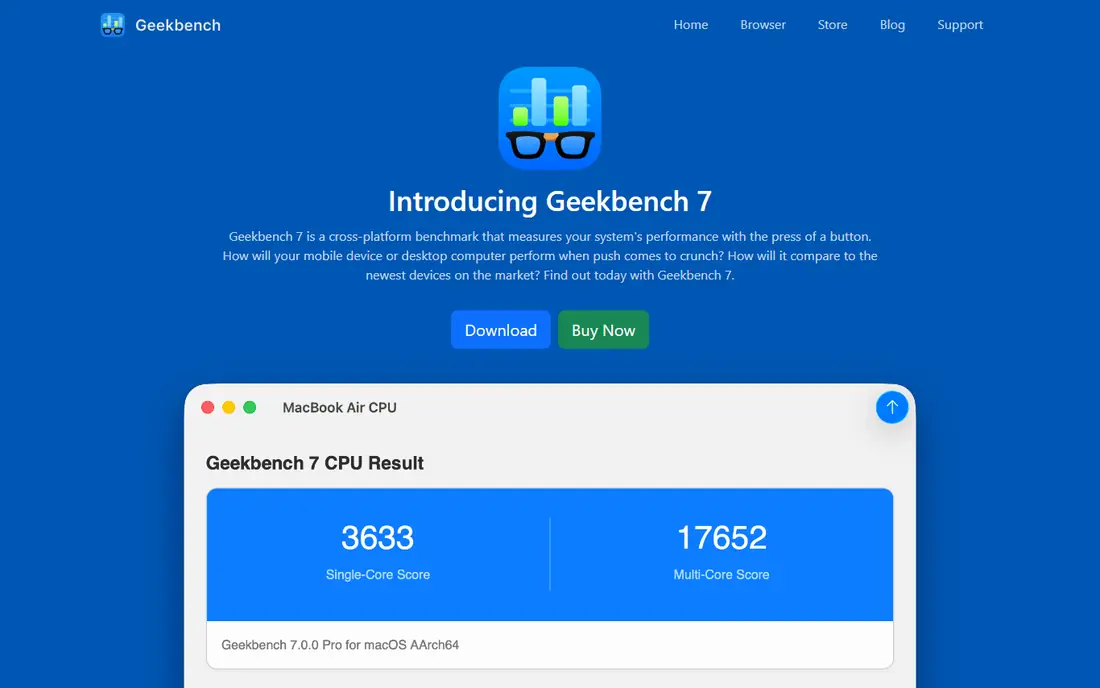
Geekbench is the easiest way to compare CPU performance across very different devices. It runs a set of real world style workloads, then reports single core and multi core scores that can be compared with results online. That cross device scale is why reviewers and buyers use it to check whether a new laptop is actually faster than an old one.
A Geekbench score is not a full system verdict. It says little about disk speed, graphics performance, or battery life, so pair it with a disk or graphics test when those matter. For a quick, comparable CPU check, Geekbench is the best starting point on this list.
- Common scores across phones, laptops, and desktops
- Single core and multi core CPU results
- Online result browser for comparison
- Paid licence for full desktop use in many cases
- A CPU score does not show disk or graphics limits

Cinebench from Maxon renders a complex scene using the CPU, which makes it a strong test for creators, editors, and anyone who renders 3D work. Multi core scores show how well a CPU uses all its cores, while single core scores show responsiveness for lighter tasks. Because it is free, it is easy to run before and after an upgrade or a cooling change.
Rendering is only one workload, so a high Cinebench score does not guarantee fast gaming or fast office work. Heat also matters, because a laptop that throttles during a long render will score lower than the same chip in a well cooled desktop. Run it twice and note temperatures for a fair read.
- Free to download and run
- Tests CPU rendering with a real Cinema 4D workload
- Multi core results show scaling clearly
- Focused on rendering, so it does not test gaming or office work
- Long runs heat laptops and can throttle scores
3DMark from UL is the standard gaming benchmark for Windows PCs. Different tests target entry, mid range, and high end graphics, from basic DirectX scenes to ray tracing workloads, so a result can be compared with similar graphics cards online. It also reports frame rates and system details, which helps when a game runs slowly and the cause is unclear.
The free demo covers only some tests, and the full version is paid, so check which test matches your hardware before buying. Driver version, resolution, and background apps all affect scores, so keep settings consistent when comparing two machines. For gaming graphics, 3DMark remains the most comparable tool available.
- Dedicated gaming graphics tests for different performance levels
- Online comparison database
- CPU and GPU combined tests
- Paid full version for most tests
- Results depend on drivers and settings
PCMark 10, also from UL, measures the kind of work most people actually do, including web browsing, document editing, spreadsheets, and video conferencing. That makes its overall score more useful for an office laptop buyer than a rendering or gaming score alone. Laptop tests can also measure battery life under a realistic workload.
It is not the right tool for a gaming PC or a render workstation, where 3DMark and Cinebench give sharper answers. For a general purpose laptop or office desktop, PCMark 10 gives a balanced score that reflects daily use rather than one extreme workload.
- Tests everyday tasks such as browsing, writing, and video calls
- Battery and application benchmarks for laptops
- Clear overall score
- Paid full version
- Less useful for pure gaming or rendering comparisons
PassMark PerformanceTest gives a full system score plus separate scores for CPU, 2D and 3D graphics, memory, and disk. That breakdown helps when an overall score looks low, because you can see which part is holding the system back. The online baseline database lets users compare a machine with thousands of similar systems.
The interface looks older than Geekbench or 3DMark, and the full version is paid after a trial. For a technician or a buyer who wants one suite to test everything, though, PerformanceTest is efficient, because it covers parts that single purpose tools miss.
- Tests CPU, graphics, disk, memory, and more in one suite
- Large online baseline database
- Detailed component scores beside the overall score
- Interface is dated
- Full version is paid
CrystalDiskMark is the go to free tool for storage speed. It reports sequential speeds for large files and random speeds for small files, which together explain why a drive feels fast for video but slow for many small files. That detail matters when choosing an SSD, because headline sequential speeds alone can mislead.
Storage is only one part of a system, so CrystalDiskMark should sit beside a CPU and graphics test for a full picture. Run it with a consistent test size, and note how full the drive is, because a nearly full SSD often scores lower. For a free, focused disk test, it is hard to beat.
- Free and simple to run
- Sequential and random read and write results
- Useful for SSD and USB drive comparisons
- Tests storage only
- Results vary with drive fill level and test size
FurMark stresses a graphics card with a demanding render, which reveals cooling and stability problems that a short game session may hide. Users watch temperature, clock speed, and frame rate, and a card that crashes or throttles hard under FurMark needs attention before it is trusted for long gaming sessions.
FurMark load is heavier than typical gaming, so a high temperature in FurMark does not always mean a card is faulty. Use it as a stability and cooling check, not as a gaming score, and stop the test if temperatures climb beyond the maker's guidance. Paired with 3DMark, it covers both gaming speed and graphics stability.
- Free GPU stress test
- Shows temperatures and stability under load
- Useful after overclocking or a cooling change
- Extreme load is heavier than most games
- Not a general gaming benchmark
Blender Benchmark runs real Blender scenes on CPU or GPU and reports render times, which makes it ideal for 3D artists who actually use Blender. Results can be compared with other systems through Blender Open Data, so a buyer can check whether a new graphics card will cut render times for their kind of scene.
It does not test gaming, office work, or general system speed, so it belongs beside a broader benchmark for a full verdict. For Blender users, though, it is more relevant than a generic score, because it measures the exact workload they run every day.
- Free and based on real Blender scenes
- Tests CPU and GPU rendering
- Results comparable through the Blender Open Data site
- Focused on Blender rendering only
- Download and scene setup take time
Novabench is a quick free system benchmark for users who want one overall score without buying a suite. It tests CPU, GPU, RAM, and disk, then reports component scores and a total that can be compared online. That makes it useful for a first check after an upgrade or when a computer feels slow.
Specialist tools give deeper answers for each part, so Novabench is a starting point rather than a final verdict. If its disk score looks low, confirm with CrystalDiskMark, and if its GPU score looks low, confirm with 3DMark. For a free, fast overview, Novabench does the job well.
- Free and quick to run
- Scores CPU, GPU, RAM, and disk in one pass
- Online comparison for results
- Less detailed than specialist tools
- Smaller comparison database than PassMark
How we picked these
We looked for tools that are still available in October 2026, that test a named part of a system, and that publish results in a comparable form. For each tool, we checked the vendor site for its stated test type and pricing, and we kept only tools with a working official homepage. We favoured tools with a public comparison database, because a score without context is hard to use.
We did not rank tools on a single score, because CPU, graphics, disk, and everyday scores measure different things. Where a tool offers a free version or trial, we say so. Always run a benchmark on a machine in a normal state, with drivers updated and background apps closed, and repeat the run before drawing a conclusion.
Running benchmarks fairly
Close background apps
Browsers, updates, and cloud sync can steal CPU and disk time. Close them before a run, and avoid running two benchmarks at once.
Repeat the run
Run each test at least twice and note both scores. A large gap between runs usually points to heat, throttling, or a background task.
Keep settings consistent
Use the same resolution, test size, and driver version when comparing two machines. Changing one setting can move a score more than a hardware change.
Check temperatures
A fast chip in a hot laptop will throttle and score below its potential. Note CPU and GPU temperatures beside the score, especially for Cinebench and FurMark.
Frequently asked questions
What is the best benchmark software for a PC?
Geekbench is a good all round starting point for CPU comparison, PassMark PerformanceTest gives a fuller system score, and 3DMark is best for gaming graphics. Use a combination rather than one score for a full verdict.
What is the best free benchmark software?
Cinebench, CrystalDiskMark, FurMark, Blender Benchmark, and Novabench are all free and cover rendering, disk, graphics stability, and overall system speed. Together they give a useful picture without paying for a suite.
How do I benchmark my CPU?
Run Geekbench for single and multi core scores and Cinebench for rendering performance, with background apps closed and the machine cool. Compare results with the same chip online, and repeat each test to check for throttling.
Is UserBenchmark a good benchmark tool?
UserBenchmark is widely known but its scoring and rankings have drawn criticism from reviewers, so we did not include it in this list. For comparable results, Geekbench, Cinebench, 3DMark, and PassMark offer clearer methods and larger comparison databases.
Why do benchmark scores vary between runs?
Heat, background tasks, driver versions, power settings, and drive fill level all move scores. Repeat runs, close background apps, and keep settings consistent to reduce variation.
Do benchmark scores predict real world speed?
They predict speed for the workload they test, such as rendering or gaming, but not for every task. A high CPU score does not fix a slow disk, and a high graphics score does not fix a weak CPU, so test the parts that matter for your work.
Sources we checked (9)

Online Jobs is an independent blog about careers, online work, learning new skills and the tools that help people earn. More about us.
Keep reading
All posts
Zoom Alternatives
Zoom alternatives compared for 2026: Google Meet, Microsoft Teams, Webex, Jitsi and more for free calls, large meetings and webinars for teams and classrooms.

Which Software Is Best for Data Entry
Compare the best data entry software for forms, OCR scanning, and spreadsheets, with free plans, pricing, and honest limits for each tool before you commit.

What Is the Best Free Tool to Rotate a PDF
What is the best free tool to rotate a PDF? We compare eight free rotation tools on per-page control, limits, privacy and saved output quality in detail.