Alternatives to InfluxDB in 2026: 8 Time-Series Databases Compared

How we put this together: we compare official feature and pricing pages, app store listings, privacy policies and public user reviews. Prices change, so check the provider's site before you pay.
Key takeaways
- TimescaleDB is the easiest move for teams already running PostgreSQL, because it adds time-series features to a database they already know.
- QuestDB and VictoriaMetrics are strong free starting points, with QuestDB favouring fast SQL analytics and VictoriaMetrics favouring Prometheus style metrics.
- ClickHouse and Apache Druid suit large analytical workloads, but both need more operational skill than a managed time-series service.
- Prometheus remains the default for Kubernetes metrics, even though long term storage and high cardinality need careful planning.
- Self-hosted open source software is free to download, but hosting, storage, backups, and staff time still cost money, so compare total cost, not licence cost alone.
Quick comparison
| Name | Who it suits | Starting price | Free option | |
|---|---|---|---|---|
 TimescaleDB | PostgreSQL teams | $30 per month | Yes | Visit |
 QuestDB | Fast SQL time-series analytics | Free | Yes | Visit |
 VictoriaMetrics | Prometheus style metrics at scale | Free | Yes | Visit |
 ClickHouse | Large analytical workloads | Free | Yes | Visit |
 Prometheus | Kubernetes and service metrics | Free | Yes | Visit |
 Apache Druid | Real time analytical queries | Free | Yes | Visit |
 TDengine | Industrial IoT and edge data | Free | Yes | Visit |
 GreptimeDB | Cloud native unified observability | Free | Yes | Visit |
The best alternatives to InfluxDB
We compared databases that store timestamped data well, handle high write rates, and support the queries teams actually run on metrics, sensor data, and events. The list below mixes managed services with open source software you run yourself.
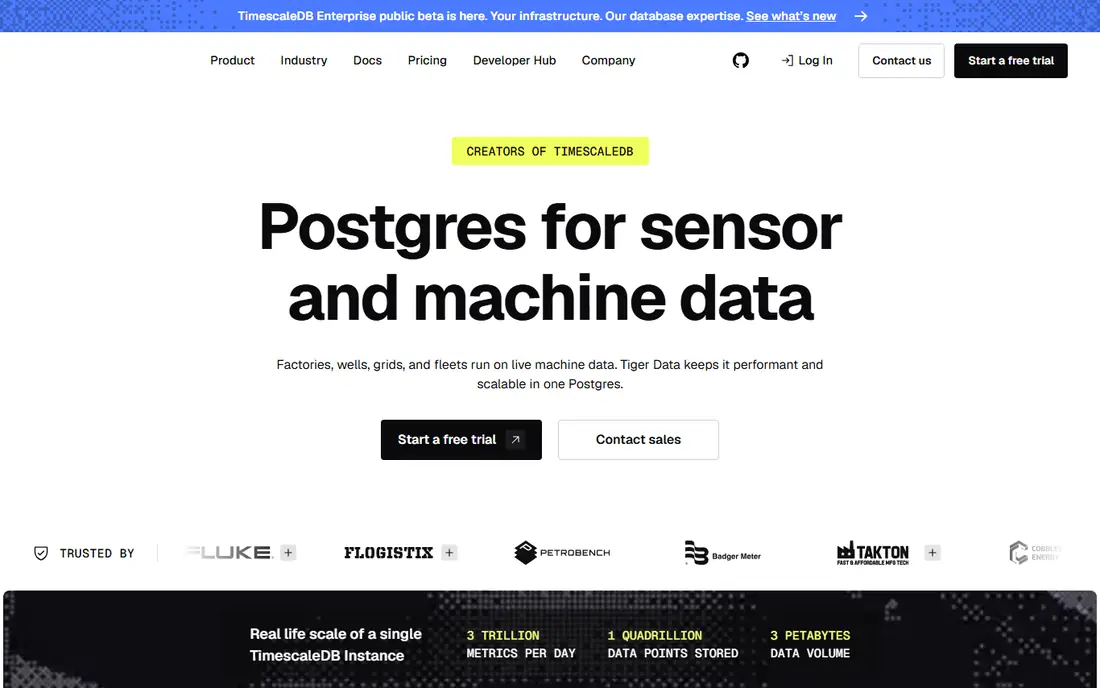
TimescaleDB is our pick for most teams leaving InfluxDB, especially if they already use PostgreSQL. You keep standard SQL, joins, and the PostgreSQL ecosystem, and you add hypertables, compression, continuous aggregates, and retention policies for time-series data. That familiarity shortens hiring, training, and debugging, because your team does not need to learn a new query language just to read sensor data.
The catch is cost at scale. The open source core is free to run yourself, while managed Tiger Cloud plans start from $30 per month for a performance tier and rise with the resources you choose. TimescaleDB also handles relational queries better than pure metrics stores, which makes it a good fit for applications that mix time-series data with customer, device, or order records.
- Full PostgreSQL compatibility
- Familiar SQL for most developers
- Managed cloud option with compression and retention tools
- Managed pricing rises with compute and storage
- Some advanced features need the managed service or a paid tier
- Less specialised than a pure metrics engine for very high cardinality
QuestDB is built for speed on timestamped data, and it shows in workloads such as market data, telemetry, and high frequency sensor streams. It speaks SQL with time-series extensions, so analysts can use familiar queries with additions for sampling, latest values, and as-of joins. The open source engine is free, which makes a proof of concept cheap to start.
The honest limit is operations. High availability, enterprise support, and managed cloud options sit behind paid tiers, so a small team running QuestDB itself needs a plan for backups, failover, and upgrades. QuestDB fits teams that value raw query speed and SQL access over a large managed service catalogue, and who are comfortable running a database in production.
- Very fast ingestion and SQL queries on time-series data
- Open source core under Apache 2.0
- PostgreSQL wire compatibility for common tools
- Enterprise features are quote based
- High availability in the free tier is limited
- Smaller ecosystem than PostgreSQL
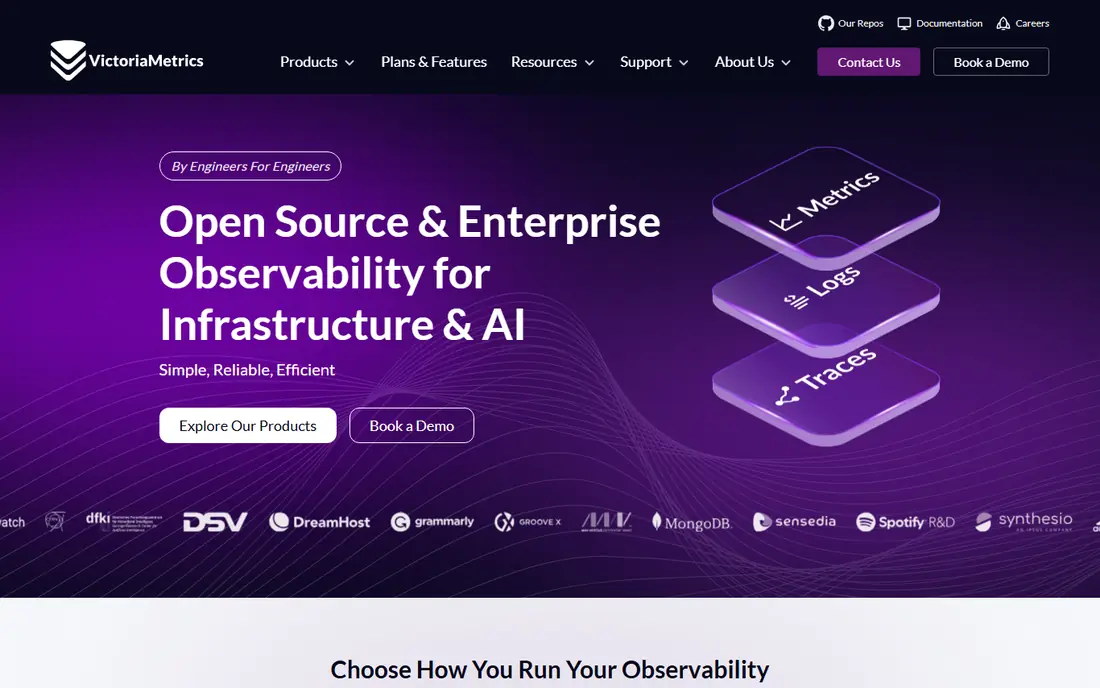
VictoriaMetrics is the natural choice for teams that already collect metrics with Prometheus and need longer retention or higher scale. It accepts Prometheus remote write data, works with Grafana, and stores metrics efficiently, which helps when metric volume grows faster than budget. The open source version is free and simple to deploy, which lowers the barrier to a trial.
The catch is that VictoriaMetrics is a metrics system first, not a general purpose database. If you need joins with business data, complex relational queries, or document style records, TimescaleDB or ClickHouse will fit better. VictoriaMetrics fits platform and observability teams that want Prometheus compatibility without paying for a large commercial metrics service.
- Drop in compatibility with Prometheus tooling
- Efficient storage for metrics
- Single binary deployment for the open source version
- Managed cloud pricing varies by usage
- Query language differs from standard SQL
- Very high cardinality still needs design care
ClickHouse earns its place when the question is analytical rather than operational. It scans large time ranges fast, compresses historical data well, and handles wide event tables that would strain a row based database. Teams use it for product analytics, log analysis, and long term observability data where queries touch millions of rows at once.
The downside is running it well. A single node is simple, but a production cluster with replication, backups, and upgrades needs real database operations skill, and managed cloud costs are usage based. ClickHouse fits data teams with analytical workloads and the staff to run it, rather than small teams that want a simple drop in metrics store.
- Columnar storage for fast analytical queries
- Strong compression
- Free self-hosted version with wide SQL support
- Operational skill needed for clusters
- Managed cloud is usage based and can rise quickly
- Not ideal for frequent single row updates
Prometheus is still the default metrics system for Kubernetes, and for good reason. Exporters cover servers, databases, queues, and cloud services, and its alerting and Grafana integration are well understood by platform teams. If your main need is service health, latency, and error rates inside Kubernetes, Prometheus is often the simplest answer.
The limit is time horizon. Prometheus keeps recent data locally and works best for short to medium retention, so teams that need months or years of history usually pair it with a long term store such as VictoriaMetrics, Thanos, or Mimir. Prometheus fits teams that already run Kubernetes and want a proven, free metrics core without a vendor contract.
- Standard for Kubernetes monitoring
- Large ecosystem of exporters and alerts
- Free open source software
- Local storage is not built for very long retention
- High cardinality can strain resources
- Long term storage needs another tool
Apache Druid is designed for interactive analytics on data that arrives continuously. Product teams use it for dashboards that slice event data by dimensions and time, with queries that return in seconds over large datasets. It handles streaming ingestion well, which makes it a strong fit for clickstream, advertising, and operational analytics.
The trade off is complexity. Druid is a distributed system with several services to run, tune, and monitor, so it is not a weekend replacement for a single node InfluxDB instance. Druid fits larger teams with real time dashboard needs and the engineering capacity to operate a cluster, rather than small teams that want a simple metrics store.
- Real time ingestion with fast analytical queries
- Strong for dashboards on streaming data
- Open source with a mature community
- Cluster setup is complex
- Resource use can be high
- Learning curve is steeper than a single node database
TDengine takes a different approach to IoT data by treating each device as a table, which helps when you have thousands of sensors sending readings on a schedule. It is used in energy, manufacturing, and connected device projects where device count and write rate matter more than ad hoc business queries. The open source version is free, and a managed cloud option exists for teams that do not want to run it themselves.
The catch is ecosystem fit. If your team already uses PostgreSQL, Prometheus, or Grafana heavily, you should test TDengine integration early, because tooling and community examples are thinner in some areas. TDengine fits industrial and IoT teams that need efficient device data handling and are willing to learn a purpose built system.
- Built for IoT and industrial sensor data
- Efficient handling of many devices
- Open source core with cloud options
- Smaller Western ecosystem than PostgreSQL or Prometheus
- Some features are paid
- Documentation depth varies by use case
GreptimeDB aims to unify observability data in one database, so metrics, logs, and traces do not each need a separate store. That idea appeals to teams tired of running three systems for one incident investigation, and its cloud native design fits Kubernetes deployments. The open source version is free, which makes it easy to test against a real workload.
The honest limit is maturity. GreptimeDB is younger than the established options here, so community examples, third party integrations, and long term production stories are thinner. GreptimeDB fits teams building new observability stacks who value a unified store and are comfortable evaluating a newer project with a proof of concept first.
- One store for metrics, logs, and traces
- Cloud native design
- Open source core with managed cloud option
- Younger project than TimescaleDB or Prometheus
- Managed pricing is usage based
- Ecosystem is still growing
How we picked these
We compared official project pages, pricing pages, and public comparisons checked in October 2026, and we favoured databases that are actively maintained, that truly store timestamped data, and that cover different needs, from SQL analytics to Prometheus metrics to real time dashboards. We did not claim benchmark testing on your workload, because time-series performance depends heavily on cardinality, write rate, retention, and query shape. A short proof of concept on your own data is the only reliable test.
How to choose the right replacement
Start with what you already run. If PostgreSQL is already in your stack, TimescaleDB is usually the lowest risk move. If Prometheus already collects your metrics, VictoriaMetrics extends that setup with the least rework. If your queries are analytical and scan large ranges, test ClickHouse or Druid. If your data comes from thousands of devices, test TDengine or GreptimeDB.
Questions to answer before you migrate
How long must you keep data, and how often do you query old data. How many distinct series or devices do you have, and how fast do they grow. Do you need SQL joins, or are metric queries enough. Can your team run a cluster, or do you need a managed service with support and backups. Answer those four questions first, then run the top two candidates side by side on a copy of real data for at least a week.
Frequently asked questions
What are the best InfluxDB alternatives?
TimescaleDB is the best general starting point for most teams, QuestDB suits fast SQL analytics, VictoriaMetrics suits Prometheus metrics at scale, and ClickHouse suits large analytical workloads. The right choice depends on your query style, your existing stack, and whether you need a managed service.
Is TimescaleDB a good replacement for InfluxDB?
Yes, for many teams, because it uses standard PostgreSQL SQL, supports joins with business data, and adds compression, retention, and continuous aggregates for time-series tables. Teams that need very high cardinality metrics may still prefer VictoriaMetrics or a dedicated metrics store.
Can I migrate from InfluxDB without rewriting all my queries?
It depends on the target. Prometheus compatible tools keep much of your metrics workflow, while SQL based tools require rewriting InfluxQL or Flux queries into SQL. Plan for a migration period where you write to both systems and compare query results before you switch reads over.
Are these alternatives free?
The open source versions of QuestDB, VictoriaMetrics, ClickHouse, Prometheus, Druid, TDengine, and GreptimeDB are free to download and run yourself. Managed cloud services, support, and enterprise features cost money, and hosting and storage add to the total even when the software itself is free.
Which alternative is best for IoT sensor data?
TDengine and GreptimeDB are designed with device and observability data in mind, while TimescaleDB is strong when sensor data must join with relational records. Test with your device count and write rate, because a system that handles a hundred devices well may struggle with a hundred thousand.
Do I need a managed service or can I self-host?
Self-hosting saves licence and service fees but costs staff time for backups, upgrades, monitoring, and incident response. A managed service costs more each month but shifts that operational work to the vendor. Small teams and critical production systems often benefit most from a managed option.
Sources we checked (10)

Online Jobs is an independent blog about careers, online work, learning new skills and the tools that help people earn. More about us.
Keep reading
All posts
n8n Alternatives
n8n alternatives compared for 2026, with Zapier, Make, Activepieces, and more, covering visual builders, code steps, self-hosting, and pricing models.

ZoomInfo Alternatives
The best ZoomInfo alternatives in 2026, compared on price, free plans, data coverage, and which tool fits small teams or large sales teams best in detail.

Workday Alternatives
We compared the best workday alternatives for HR, payroll, and global hiring, from BambooHR and Gusto to Rippling, Deel, and HiBob for growing teams in 2026.