Best Alternatives to Grafana in 2026: 8 Tools Compared

How we put this together: we compare official feature and pricing pages, app store listings, privacy policies and public user reviews. Prices change, so check the provider's site before you pay.
Key takeaways
- Datadog and New Relic are the closest full replacements for Grafana, with dashboards, alerts, and traces in one paid platform.
- Prometheus pairs well with Grafana itself, but it also works as a standalone open source metrics store when you add your own dashboards.
- Kibana suits teams already running Elastic, while Zabbix and SigNoz suit teams that want more control or lower licence costs.
- Open source Grafana alternatives still need hosting, upgrades, and alert setup, so the licence saving is not the whole cost.
Quick comparison
| Name | Who it suits | Starting price | Free option | |
|---|---|---|---|---|
 Datadog | Full monitoring in one platform | See website | Free trial | Visit |
 Prometheus | Open source metrics collection | Free | Yes | Visit |
 Kibana | Logs and search with Elastic | See website | Free trial | Visit |
 New Relic | Application monitoring and dashboards | See website | Yes | Visit |
 Zabbix | Self-hosted infrastructure monitoring | Free | Yes | Visit |
 Dynatrace | Automated monitoring for large systems | See website | Free trial | Visit |
 SigNoz | Open source observability with traces | Free | Yes | Visit |
 Uptime Kuma | Simple uptime checks for small teams | Free | Yes | Visit |
The best alternatives to Grafana
Grafana is mainly a visualisation layer. It shows data from other systems, but it does not collect all of that data by itself. That is why the best Grafana alternatives fall into two groups: full platforms that collect and show data, and open source tools that replace one part of the stack. We compared official documentation, pricing pages, and feature pages for tools that are still maintained in 2026.
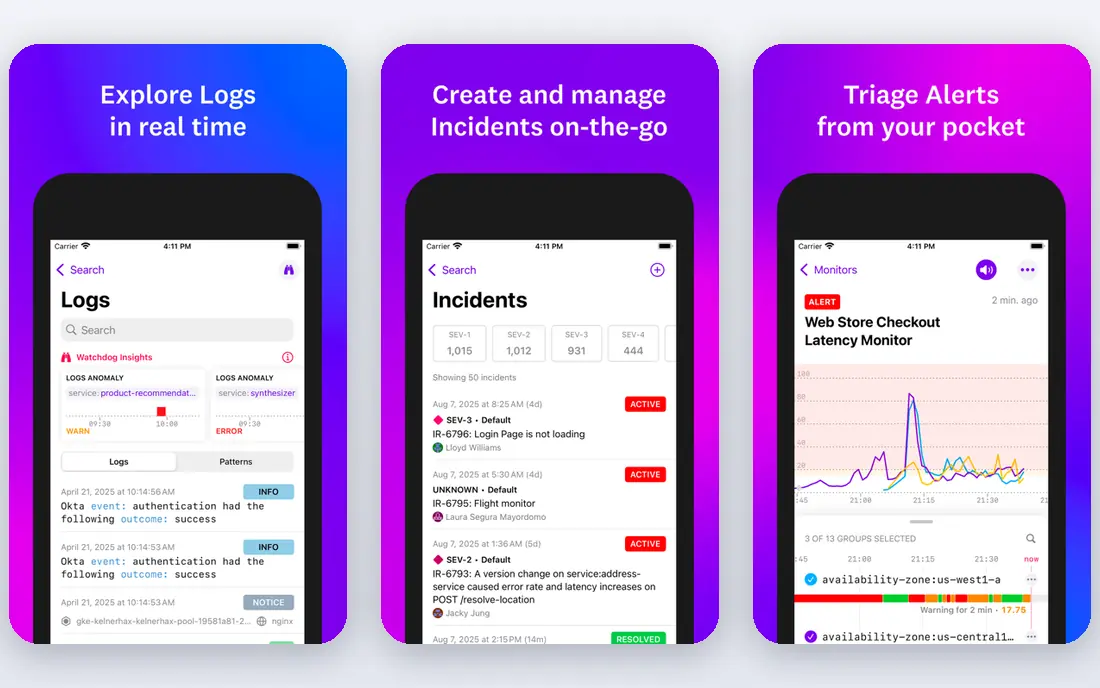
Datadog is the most direct paid replacement for a Grafana setup that has grown messy. Instead of wiring several data sources into dashboards by hand, you get infrastructure monitoring, application monitoring, logs, and traces from one vendor, with dashboards and alerts built on top. That single view helps when an incident spans servers, apps, and databases.
The catch is cost control. Datadog charges by hosts, containers, and data ingested, so a team that adds every log source without limits can see a large bill. Set retention, sampling, and log exclusions early, and use the trial to model a month of real usage before you commit.
- Metrics, logs, and traces in one place
- Large integration library
- Strong alerting and dashboards
- Costs can grow quickly with usage
- Pricing is based on hosts and data volume
- Smaller teams may find it complex
Prometheus is often paired with Grafana, so listing it as an alternative needs a note. It collects and stores metrics, and it has its own query language and basic web interface, but most teams still add a dashboard tool on top. As a Grafana alternative, it fits teams that want to own the metrics layer and build their own views.
The trade-off is effort. You handle storage, retention, high availability, and alert rules yourself, and long-term storage usually needs an extra component. If you want a polished dashboard out of the box, Prometheus alone will disappoint. If you want control and no licence fee, it is a solid base.
- Free and open source
- Strong for time-series metrics
- Large exporter ecosystem
- No built-in long-term storage at scale
- Dashboards need another tool
- Setup and scaling take work
Kibana is the visualisation tool for Elastic, and it suits teams that already store logs in Elasticsearch. You can search logs, build dashboards, and set alerts without adding another vendor, and its search strength helps when you need to find one event in millions of log lines. For log-heavy teams, that search-first approach beats a metrics-first dashboard.
The limit is scope. Kibana shines with Elastic data and is less natural as a general dashboard for every other data source. If your team does not already use Elastic, the setup cost is higher than picking a platform that collects data for you. If Elastic is already in place, Kibana is the obvious next step.
- Strong search and log analysis
- Good dashboards for Elastic data
- Useful for security and observability
- Best inside the Elastic stack
- Learning curve for query syntax
- Hosted costs vary with data volume
New Relic covers application performance, infrastructure, logs, and browser monitoring, with dashboards that are ready to use rather than built from scratch. Its free tier gives smaller teams a real way to start, including a monthly data allowance and basic users, which makes it easier to test than a trial-only platform.
The honest catch is the usage model. Once you pass the free data allowance, costs depend on data ingested and users, so a noisy app can push you into a paid plan quickly. Use the free tier to learn which data you actually look at, then trim the rest before you upgrade.
- Free tier for smaller use
- Application and infrastructure monitoring
- Clear dashboards and alerts
- Paid tiers are usage based
- Some features need higher plans
- Data limits apply on free tier
Zabbix is a long-running open source monitor for servers, networks, and services. It collects metrics, checks availability, and sends alerts based on triggers you define, and it includes dashboards and graphs without a separate tool. For an IT team that wants to monitor hardware and services on its own servers, it is a proven choice.
The downside is age and style. The interface is functional rather than polished, and modern application tracing is not its strength. It also needs care in setup, from templates to database sizing. If your main need is infrastructure health and uptime, Zabbix is strong. If you need deep application traces, pair it with another tool or pick a full platform.
- Free and open source
- Monitors servers, networks, and services
- Flexible triggers and alerts
- Interface feels dated
- Setup and templates take time
- Less suited to modern application traces
Dynatrace aims to reduce manual setup. It discovers services, maps dependencies, and tries to point to the root cause when something fails, rather than leaving you to stitch dashboards together. For large, complex systems with many services, that automation saves real time during incidents.
The price and weight are the trade-offs. Dynatrace is priced for enterprises, and small teams may find the platform more than they need. Use the trial on a real service, not a demo, and check how its automatic detection handles your specific stack before you sign.
- Automatic discovery of services
- AI-assisted problem detection
- Broad cloud and app coverage
- Enterprise pricing
- Can be heavy for small teams
- Trial needed to judge total cost
SigNoz is a newer open source observability platform that brings metrics, logs, and traces into one interface. It is built on OpenTelemetry, which is the current standard for sending observability data, so many modern apps can send data to it without custom code. That combination makes it a strong open source Grafana alternative for teams that also want traces.
The catch is maturity and hosting. You run it yourself or pay for cloud hosting, and you handle upgrades and scaling. The community is smaller than Prometheus or Zabbix, so answers to edge-case questions can take longer. For a team comfortable with self-hosting, it offers a lot for no licence fee.
- Free and open source
- Metrics, logs, and traces together
- OpenTelemetry based
- Self-hosting takes effort
- Smaller community than older tools
- Some enterprise features are paid
Uptime Kuma does one job well. It checks whether your websites and services are up, shows a simple status page, and notifies you through common channels when something goes down. For a small team, a side project, or a personal site, that is often all the monitoring you actually need.
Do not expect it to replace Grafana for metrics, logs, or application performance. It has no deep query engine and no trace view. Use it as a simple uptime layer, and add a fuller platform only when you need to understand why a service is slow, not just whether it is up.
- Free and open source
- Very easy to set up
- Status pages and notifications included
- Only uptime and simple checks
- No deep metrics or traces
- Not a full Grafana replacement
How we picked these
We compared official documentation, pricing pages, and release status for tools that are maintained in 2026 and that cover dashboards, metrics, logs, or uptime. We kept a mix of paid platforms and open source tools, and we noted where a tool only replaces part of a Grafana stack. We did not claim hands-on testing, and we did not invent prices or feature claims. Where pricing is usage based or quoted, we wrote See website.
How to choose a Grafana alternative
Start by naming what Grafana does for you today. If it is mainly dashboards over Prometheus, an open source tool may be enough. If it is dashboards over many sources plus alerts and incident work, a full platform will save more time, even at a higher price.
Count the hidden work in open source
Free tools still cost time for hosting, upgrades, backups, and alert tuning. Estimate that time honestly, and compare it with a paid plan. For a team with no one to own monitoring, a paid platform is often cheaper in practice than a free tool that no one maintains.
Test with your real data sources
A demo dashboard can look good with sample data and fail on your real stack. Connect your main services during a trial, build one dashboard you actually use, and set one alert you actually need. If that workflow feels slow or confusing, the tool is not right, whatever its feature list says.
Frequently asked questions
What are the best Grafana alternatives?
Datadog and New Relic are the best full-platform Grafana alternatives, while Prometheus, Zabbix, and SigNoz are strong open source options. Kibana is best for teams already using Elastic, and Uptime Kuma is best for simple uptime checks.
Are there open source Grafana alternatives?
Yes. Prometheus, Zabbix, SigNoz, and Uptime Kuma are all open source and free to use, although self-hosting and maintenance still take time. Grafana itself is also open source, so many teams keep Grafana for dashboards and change only the data layer.
Is Datadog better than Grafana?
Datadog is better if you want one vendor to collect, store, and display metrics, logs, and traces. Grafana is better if you want a flexible dashboard over data sources you already own and you do not mind wiring them together yourself.
Can I replace Grafana for free?
Yes, for basic monitoring, using Prometheus with a dashboard tool, Zabbix, SigNoz, or Uptime Kuma. The free route works best when someone on the team can own hosting and upgrades, and when your data volume stays modest.
Which Grafana alternative is easiest for beginners?
Uptime Kuma is the easiest for uptime checks, while New Relic has one of the gentlest starts among full platforms because of its free tier. Datadog and Dynatrace are more powerful, but they take longer to set up well.
Sources we checked (8)

Online Jobs is an independent blog about careers, online work, learning new skills and the tools that help people earn. More about us.
Keep reading
All posts
n8n Alternatives
n8n alternatives compared for 2026, with Zapier, Make, Activepieces, and more, covering visual builders, code steps, self-hosting, and pricing models.

ZoomInfo Alternatives
The best ZoomInfo alternatives in 2026, compared on price, free plans, data coverage, and which tool fits small teams or large sales teams best in detail.

Zoom Alternatives for Webinars
Compare Zoom alternatives for webinars in 2026, from browser-based rooms to enterprise events, with prices, attendee limits, features and honest trade-offs.