Best Portermetrics Alternatives in 2026: 9 Reporting Tools Compared


Established Sheets and Looker Studio pipes · Starting price: See website
How we put this together: we compare official feature and pricing pages, app store listings, privacy policies and public user reviews. Prices change, so check the provider's site before you pay.
Key takeaways
- Porter Metrics is a Looker Studio and Sheets connector priced per account, so alternatives differ mainly on pricing unit, destinations, and reporting depth.
- Supermetrics is the established connector library, while Windsor.ai and Coupler.io are strong lower-cost pipes.
- Funnel suits larger teams that need a managed data hub, while AgencyAnalytics, Whatagraph, and DashThis suit client-ready reporting.
- Count connected accounts, sources, and destinations before you compare prices, since those units decide the real bill.
- Free plans are useful for testing a connector, but they rarely cover full client reporting.
Quick comparison
| Name | Who it suits | Starting price | Free option | |
|---|---|---|---|---|
| Supermetrics | Established Sheets and Looker Studio pipes | See website | No | Visit |
 Windsor.ai | Low-cost broad connectors | See website | Yes | Visit |
 Funnel | Managed marketing data hub | See website | No | Visit |
 Coupler.io | Spreadsheet and BI data flows | See website | Yes | Visit |
 Dataslayer | Budget Sheets and Looker Studio pipes | See website | Yes | Visit |
 AgencyAnalytics | White-label client reporting | See website | No | Visit |
 Whatagraph | Polished client reports | See website | No | Visit |
 DashThis | Simple client dashboards | See website | No | Visit |
 Looker Studio | Free Google dashboards | Free | Yes | Visit |
The best Portermetrics alternatives
Porter Metrics connects ad and marketing accounts to Looker Studio, Google Sheets, and BigQuery, with pricing per connected account. The tools below either replace that pipe, add a full reporting layer on top, or both. The right pick depends on whether you need raw data, finished client reports, or a warehouse feed.
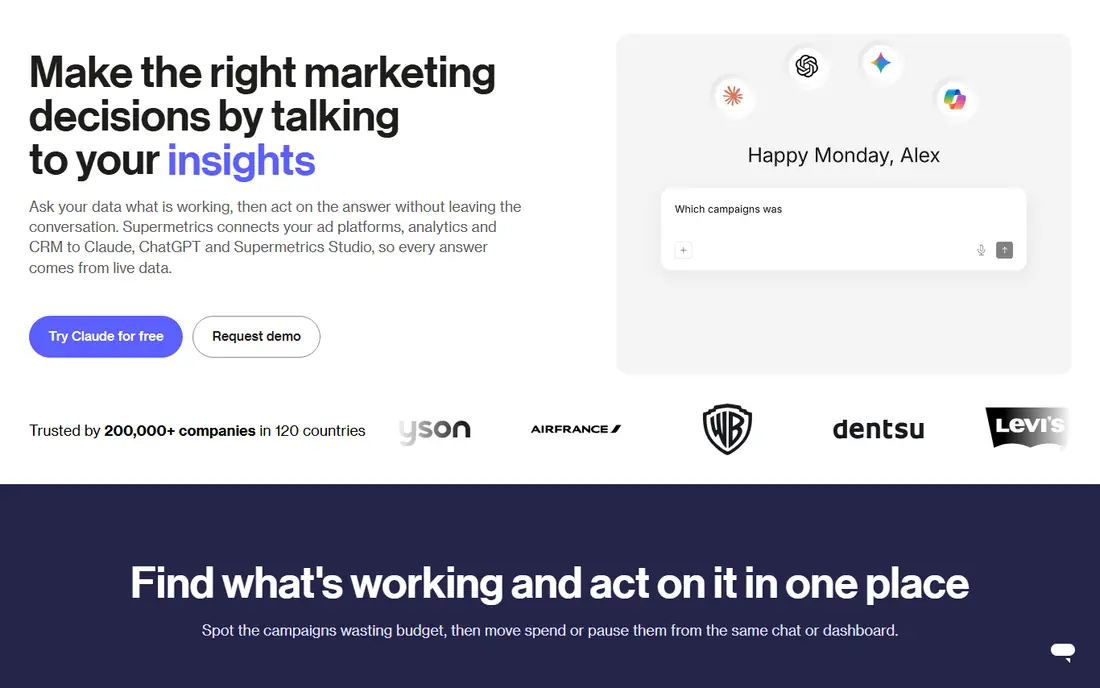
Supermetrics is the tool most reporting teams reach for first, and its connector depth is the reason. Sources, fields, and templates are well established, so a common report can be built quickly and repeated across clients. Support and docs are also mature.
The pricing model needs care. Plans meter sources, accounts, users, and destinations, so the same data sent to two destinations can cost more than expected. Agencies with many accounts should model total cost on real client counts, not on the entry price alone.
- Mature connector library
- Smooth Sheets and Looker Studio use
- Consistent data schemas
- Pricing is per destination on some plans
- Account and source limits add up for agencies
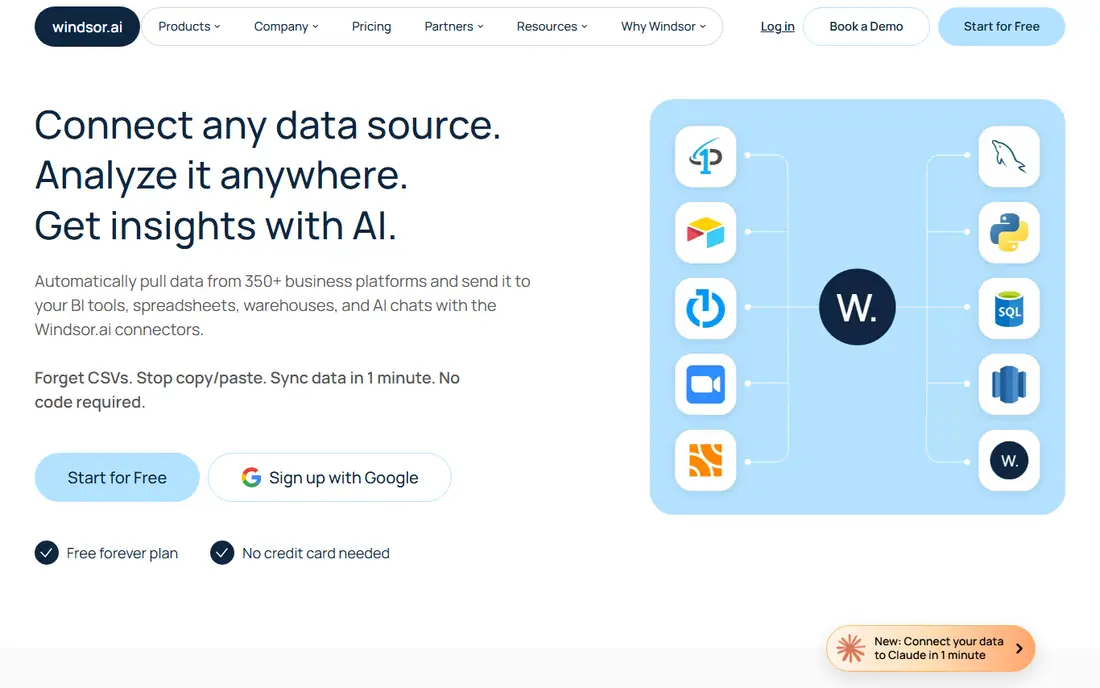
Windsor.ai is a strong Porter Metrics alternative for teams that want a pipe, not a full reporting suite. It covers many ad, social, and analytics sources, and it can send data to spreadsheets, BI tools, and warehouses. That flexibility suits teams that build their own dashboards.
It does not replace a client reporting platform on its own, since finished report design still happens in your BI tool. For a team comfortable in Looker Studio or Sheets, that split is fine. For a team that wants ready-made client reports, look at AgencyAnalytics or Whatagraph below.
- Broad source coverage at a lower entry price
- Warehouse and BI destinations
- Free plan for testing
- Reporting templates are thinner than full reporting platforms
- Limits vary by plan
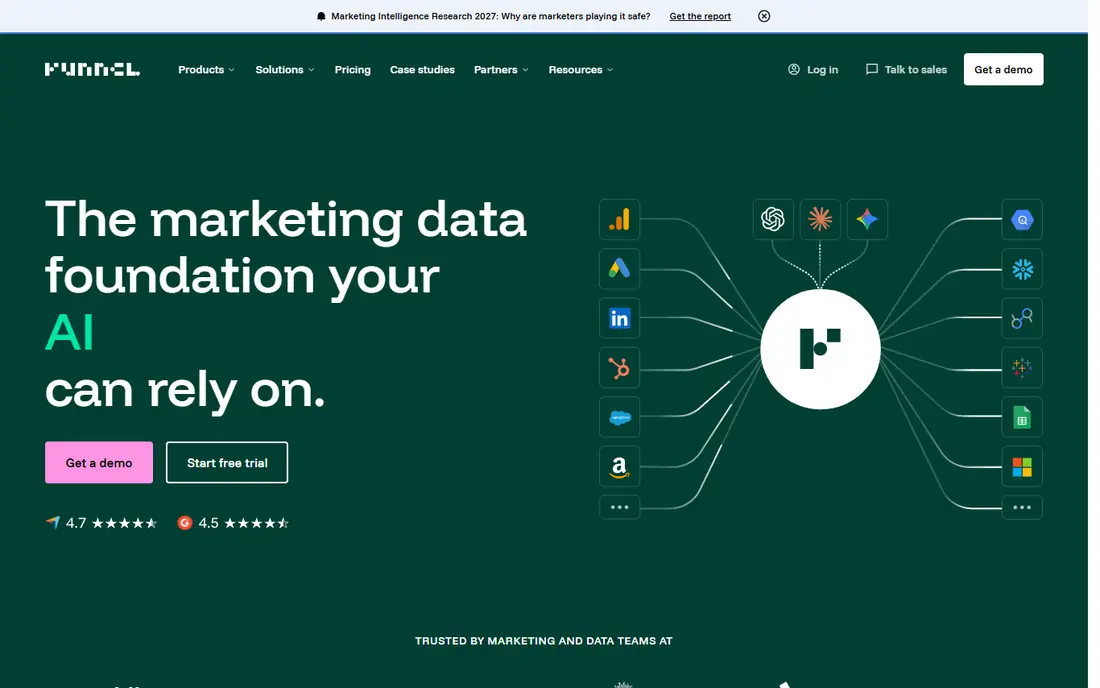
Funnel suits larger teams that treat marketing data as infrastructure. It normalizes data from many sources, applies business rules, and feeds warehouses, BI tools, and reporting platforms. That governance matters when several teams use the same numbers.
For a small agency, Funnel is more system than needed, and pricing reflects that scale. Its entry plans are aimed at teams with real data volume and a need for shared definitions. Smaller teams will move faster and cheaper with Windsor.ai, Coupler.io, or Dataslayer.
- Data harmonization and governance
- Many connectors
- Warehouse and BI outputs
- Higher entry cost and annual contracts
- Setup is heavier than a simple connector
Coupler.io is a good fit for teams that live in spreadsheets. You define a data flow from a source to Sheets, Excel, or a BI tool, schedule refreshes, and combine sources where plans allow. That clarity helps small teams automate a weekly report without learning a data warehouse.
It is a pipe, not a finished reporting platform, so dashboards and client polish happen elsewhere. Teams that want white-label client reports should pair it with a reporting tool or choose AgencyAnalytics instead. For spreadsheet-first reporting, Coupler.io is direct and affordable.
- Clear data flows to Sheets, Excel, and BI tools
- Joins and scheduling
- Free plan for testing
- Reporting design still happens in your destination tool
- Source limits vary by plan
Dataslayer appeals to teams that like the Supermetrics workflow but want a lower bill. It connects common ad and analytics sources to Sheets, Looker Studio, and Power BI, with blending on higher plans. Setup feels familiar to anyone who has used a connector before.
The trade is breadth. Its connector list is smaller than the largest pipes, so check your exact sources before switching. If your sources are covered, Dataslayer can cut cost without changing how your team builds reports. If a niche source is missing, that saving disappears.
- Similar workflow to Supermetrics at a lower price
- Sheets, Looker Studio, and Power BI support
- Free plan
- Connector depth is smaller than Supermetrics
- Row limits vary by plan
AgencyAnalytics is for agencies that sell reporting as a service. Client dashboards, scheduled reports, and a client portal come built in, and reports can carry your branding. That saves the time of building and maintaining Looker Studio templates for every client.
Pricing is typically per client, so a growing roster raises the bill in a predictable way. It is not the best raw data pipe for warehouse work, since its strength is finished reporting. Agencies that want client-facing polish will value it, while data teams will prefer a pipe above.
- Client dashboards and portals
- White-label reports
- Many integrations in one platform
- Per-client pricing adds up
- Less of a raw data pipe than Supermetrics or Windsor.ai
Whatagraph suits teams where report quality is part of the service. Templates, automated delivery, and clean visuals help an agency send reports that clients actually read. Integrations cover common ad and analytics sources, and customization is straightforward.
Cost is the main limit. It is priced above simple connectors, so a team that only needs raw data should not pay for report polish it will not use. A team that spends hours formatting Looker Studio reports each month may find the time saved justifies the price.
- Polished, ready-to-send reports
- Templates and automation
- Good for agencies and brands
- Higher price than simple pipes
- Aimed at teams that value report design
DashThis is a middle path between a raw pipe and a full reporting suite. Dashboards are quick to set up, templates cover common sources, and sharing with clients is simple. Small agencies often like it because it avoids the setup work of a BI tool.
Depth is the trade. It does not offer the data modeling and governance of Funnel, and dashboard and source limits vary by plan. For straightforward client dashboards, that simplicity is a benefit. For complex blended data, a pipe plus a BI tool gives more control.
- Simple dashboard setup
- Preset templates
- Easy sharing with clients
- Less data modeling depth than Funnel
- Plan limits on dashboards and sources
Looker Studio is not a Porter Metrics replacement by itself, but it belongs on this list because it is where Porter Metrics data usually lands. It is free, it builds dashboards from Sheets, BigQuery, and connector data, and sharing with clients is simple. Many teams already use it daily.
The catch is that Looker Studio does not fetch ad data on its own. You still need a connector, such as one above, or a manual Sheets feed. Treat Looker Studio as the free presentation layer, and budget separately for the pipe that feeds it.
- Free dashboards from Google
- Works with Sheets and many connectors
- Easy sharing
- Not a data pipe on its own
- Connectors from other vendors may cost extra
How we picked these
We compared official feature and pricing pages for data pipes and reporting platforms that serve the same job as Porter Metrics: getting marketing data into Sheets, Looker Studio, BI tools, or client reports. We did not claim hands-on testing, and where pricing depends on accounts, sources, destinations, or clients, we used See website rather than a single figure that would mislead. Prices in this market change often, so confirm the current plan page before switching.
How to choose a Portermetrics alternative
Start by counting what you actually connect. List every ad account, analytics property, and social profile, then list every destination where that data must land. A pipe priced per account suits a team with few accounts, while a pipe priced per source suits a team with many accounts on few platforms. That count matters more than the headline price.
Decide between a pipe and a platform
A pipe sends clean data to a tool you already use, such as Looker Studio or Sheets. A platform gives you finished dashboards and client reports. Data teams and BI users usually want a pipe. Agencies that send reports to clients usually want a platform, or a pipe plus a reporting tool.
Test connectors on real accounts
Free plans and trials are useful, but only a test on your real accounts shows whether fields, refresh rates, and blending work as expected. Check date ranges, currency handling, and how the tool treats renamed campaigns. A connector that misses one key field can break a whole report.
Plan for client growth
Model cost at twice your current client count, not at today's count. Per-account, per-client, and per-destination pricing all grow differently, and the cheapest entry plan can become the most expensive at scale. A short trial with a cost model beats a year on the wrong pricing unit.
Frequently asked questions
What is Porter Metrics?
Porter Metrics is a connector that sends marketing data from ad and analytics platforms to Looker Studio, Google Sheets, and BigQuery, with pricing per connected account. Teams use it to build dashboards and reports without manual exports.
What is the cheapest Portermetrics alternative?
Windsor.ai, Coupler.io, and Dataslayer are among the lower-cost pipes, and each offers a free plan for testing. The cheapest option for your team depends on how many accounts, sources, and destinations you need, so compare on your real counts.
Is Supermetrics better than Porter Metrics?
Supermetrics has a larger connector library and more mature tooling, while Porter Metrics is often cheaper per account for Looker Studio reporting. The better pick depends on your sources, destinations, and budget, not on brand alone.
Do I still need Looker Studio with these tools?
Often yes, if you use a pipe such as Supermetrics, Windsor.ai, or Dataslayer, since Looker Studio is where dashboards are built. Reporting platforms such as AgencyAnalytics and Whatagraph include their own dashboards, so Looker Studio is optional there.
Can I try these tools free?
Several pipes offer free plans, and most platforms offer a trial, though trial length and limits vary. Use a trial on real accounts to test connectors, refresh rates, and report quality before you commit.
Sources we checked (9)

Online Jobs is an independent blog about careers, online work, learning new skills and the tools that help people earn. More about us.
Keep reading
All posts
Moz Pro Alternatives
Compare Moz Pro alternatives for SEO, from free tools to full suites, including Semrush, Ahrefs, SE Ranking, and budget options for small teams today.

Constant Contact Alternatives
Compare the best constant contact alternatives for small businesses, creators and nonprofits, with free plans and automation notes to guide your switch.
Brevo Alternatives
Searching for Brevo alternatives? We compare 8 email marketing tools, from Mailchimp and MailerLite to Klaviyo and ActiveCampaign, on price and features.