Best Databox Alternatives in 2026: 8 Tools Compared

How we put this together: we compare official feature and pricing pages, app store listings, privacy policies and public user reviews. Prices change, so check the provider's site before you pay.
Key takeaways
- Looker Studio suits teams that want free dashboards and already work in Google tools, but third-party connectors can add cost.
- Klipfolio, DashThis, and AgencyAnalytics suit agencies that need client-ready reports, with different pricing models to compare carefully.
- Power BI and Tableau suit teams that need deeper data modelling and exploration beyond marketing dashboards.
- Price by your client and dashboard count, not by feature lists, because per-client and per-dashboard models punish different growth patterns.
Quick comparison
| Name | Who it suits | Starting price | Free option | |
|---|---|---|---|---|
 Klipfolio | Custom marketing dashboards | See website | Free trial | Visit |
 Looker Studio | Free Google dashboards | Free | Yes | Visit |
 Microsoft Power BI | Deep BI and modelling | See website | Yes | Visit |
 Tableau | Visual data exploration | See website | Free trial | Visit |
 AgencyAnalytics | Agency client reporting | See website | Free trial | Visit |
 DashThis | Fast client reports | See website | Free trial | Visit |
 Whatagraph | White-label agency reports | See website | Free trial | Visit |
 Geckoboard | Live TV KPI displays | See website | Free trial | Visit |
The best databox alternatives
Databox made KPI dashboards and mobile reporting easy, but teams leave it for many reasons: price as client counts grow, a need for deeper analysis, or a wish for white-label reports that fit their brand. We picked alternatives that cover agency reporting, free dashboards, and full business intelligence, so you can match the tool to your actual reporting job.
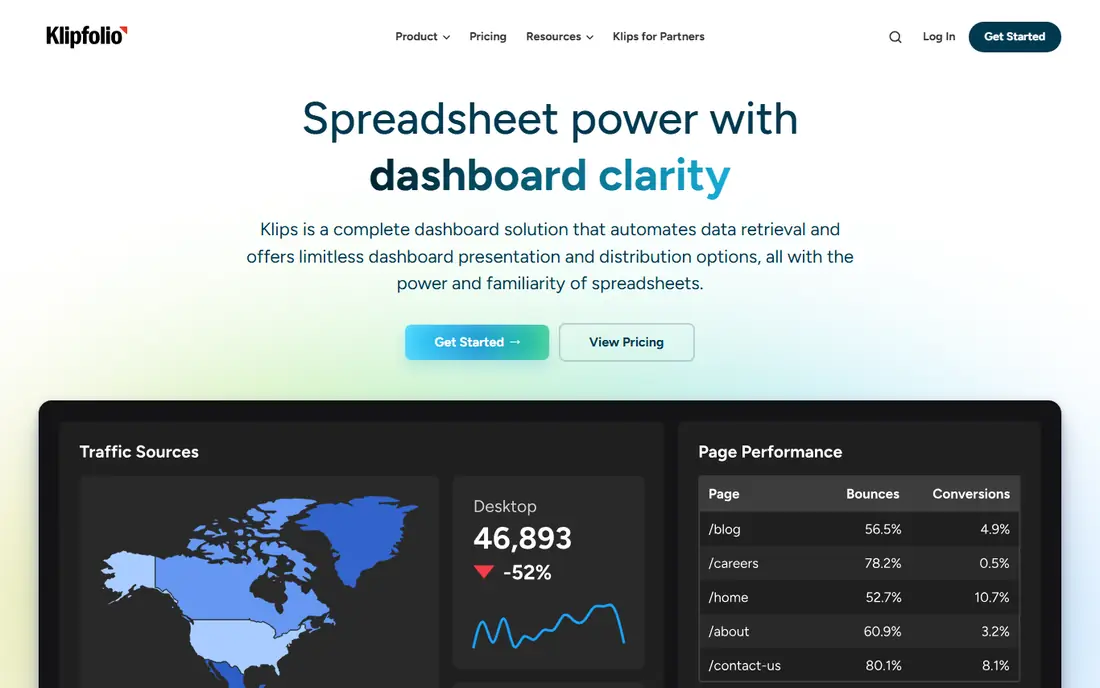
Klipfolio suits teams that want control over how each metric looks and behaves. Its Klips system lets you build custom widgets, combine sources, and define metrics once for reuse across dashboards. That control helps agencies and marketing teams that report the same KPIs in different ways for different clients, without rebuilding each dashboard from scratch. The trade is skill. Simple dashboards are quick, but advanced customisation rewards users who understand formulas, data blending, and Klipfolio logic. White-label branding also sits on higher plans or as an add-on, so agencies should price the full branded setup, not just the base plan. If your team has an analyst or a data-minded marketer, Klipfolio offers a strong Databox replacement with more custom depth.
- Flexible Klips for custom visualisations
- Many integrations
- Metric layer for consistent definitions
- Deeper custom work needs formula and data skills
- White-label options can cost extra on lower plans
Looker Studio, formerly Google Data Studio, is the free starting point for many teams. It connects natively to Google Analytics, Search Console, Sheets, and Ads, and lets you build dashboards with charts, filters, and date controls at no software cost. Sharing works through Google accounts, which suits teams already inside that ecosystem. The hidden cost is connectors. Non-Google sources, such as Facebook Ads, HubSpot, or Shopify, often need a paid third-party connector, and those fees add up across clients. Design also takes effort: Looker Studio gives you a blank canvas, not a finished client report template, so polished agency reports need design time. For in-house teams on Google data, it is excellent value. For agencies with many non-Google sources, price the connector stack before calling it free.
- Free for core use
- Strong Google integrations
- Flexible charts and sharing with Google accounts
- Third-party connectors often cost extra
- Building polished client reports takes manual design work
Power BI suits teams that have outgrown simple marketing dashboards and need real analysis. Data modelling, calculated measures, and Power Query transformations let analysts clean, join, and shape data before visualising it. That depth helps finance, operations, and larger marketing teams that need one trusted model behind many reports, rather than a separate dashboard for each question. The learning curve is steeper than Databox or DashThis, and sharing reports beyond personal use requires paid licences. Small teams that only need a weekly marketing snapshot may find Power BI heavy. Teams in the Microsoft ecosystem, or teams that need governed metrics and deep exploration, will find Power BI a powerful Databox alternative with a much wider ceiling.
- Powerful data modelling with DAX and Power Query
- Strong Microsoft ecosystem fit
- Large community and templates
- Learning curve for modelling
- Full sharing and collaboration need paid licences
Tableau is the exploration pick. Analysts can drag fields into a view, filter interactively, and ask follow-up questions without rebuilding a dashboard each time. That freedom suits data teams, larger companies, and anyone whose reporting job involves investigation, not just a monthly snapshot. Visual quality is high, and the community offers many examples and learning paths. For straightforward agency client reports, Tableau can feel like more tool than needed, and pricing reflects its enterprise positioning. It also needs data preparation and governance to shine, so teams without an analyst may underuse it. If your Databox problem is depth of analysis rather than client report speed, Tableau is a strong upgrade. If speed is the problem, an agency tool will serve you better.
- Excellent interactive visualisations
- Strong for exploration and ad-hoc questions
- Large community and learning resources
- Price and setup suit larger teams
- Simple client reporting can feel heavier than in agency tools
AgencyAnalytics is built for agencies that send branded reports to clients each month. White-label branding and client portals come with the plans, so reports can carry your logo and domain without an expensive add-on. Built-in SEO tools, including rank tracking and site audits, also help SEO agencies that previously paid for a separate rank tool alongside Databox. Pricing is per client, which makes costs easy to forecast but also means a growing roster raises the bill in a straight line. That model suits agencies with stable client counts and clear per-client fees, but it punishes rapid roster growth more than a flat dashboard plan might. If your agency sells monthly reporting as a service, AgencyAnalytics is one of the closest like-for-like Databox replacements, with branding included from the start.
- White-label reports and client portals included
- SEO rank tracking and site audits built in
- Per-client pricing is easy to model
- Per-client pricing grows with roster size
- Marketing focus means less general BI depth than Power BI or Tableau
DashThis appeals to teams that want a client-ready report in minutes, not days. Templates for common marketing sources, preset widgets, and simple layout tools let a freelancer or small agency build a clean report quickly. All integrations are available on every plan, which removes the tier guessing that frustrates users of some rivals, and unlimited users help small teams share reports without extra seat costs. Lower plans limit dashboard counts, so a growing agency may need to upgrade sooner than expected. DashThis also focuses on reporting rather than deep data modelling, so analysts who need custom calculations may prefer Klipfolio or Power BI. For speed and clarity, though, DashThis is a strong Databox alternative, especially for freelancers and small agencies that value fast setup over custom depth.
- Very fast report setup with templates
- All integrations on every plan
- Unlimited users on many plans
- Dashboard limits on lower plans can force upgrades
- Less custom modelling than Klipfolio or Power BI
Whatagraph targets agencies for whom the client report is part of the product. Reports look polished, white-label branding is central, and automation handles scheduled sends, so account managers spend less time assembling decks each month. Templates for common marketing channels speed up setup, and higher plans add AI summaries and more advanced reporting features. The price position reflects that agency focus. A freelancer with three clients may find Whatagraph costly compared with DashThis or Looker Studio, while a larger agency with many clients may find the polish and automation worth it. Price Whatagraph by total clients and required branding, and trial it with a real client report, because the value shows in the finished document, not in a feature list.
- Polished white-label client reports
- Automated reporting and templates
- AI report summaries on higher plans
- Pricing is aimed at larger agencies
- Smaller teams may find entry plans costly for a few clients
Geckoboard solves a different reporting job: making KPIs visible at a glance. It is built for TV displays in offices, where sales, support, or operations teams need live numbers without opening a dashboard. Widgets are large, clear, and easy to read from a distance, and setup focuses on live metrics rather than long monthly reports. That focus is also its limit. Geckoboard will not replace a detailed client report, a data model, or an exploration tool, so teams that need those should pair it with another product or pick a different alternative. If your Databox use was mainly a live office screen, Geckoboard is a focused and effective replacement. If you need client PDFs and deep analysis, look at DashThis, AgencyAnalytics, or Power BI first.
- Built for live TV and wall displays
- Clear, glanceable KPI widgets
- Easy sharing for office screens
- Less suited to detailed client reports or deep analysis
- Pricing is per display use case rather than general BI
How we picked these
We compared official feature pages, pricing pages, and public comparison documentation for dashboard and reporting tools that serve as Databox replacements. We favoured products that are actively maintained, that connect to common marketing and business sources, and that cover a distinct reporting job, from free dashboards to agency white-label reports to live TV displays. Where pricing could not be confirmed from the vendor site at the time of writing, we listed it as See website. We did not claim hands-on testing, and we treated per-client and per-dashboard pricing as a key comparison point because it changes total cost as teams grow.
How to choose the right option
Price the roster, not the first month
List your clients, dashboards, and data sources, then price each tool at that size, plus the size you expect in a year. A tool that looks cheap for three clients can become costly at twenty, and vice versa. Include connector fees, white-label add-ons, and seat costs in the total, because vendors count different things.
Test with a real client report
Build one real report in your top two tools, using real data and your branding. Check setup time, visual quality, scheduled sending, and how a client reads the result. A trial with sample data hides the messy parts: odd metrics, missing sources, and branding limits that only appear with real work.
Decide who owns the data model
Simple reporting tools work when each dashboard is independent. Larger teams need one trusted definition for revenue, leads, or churn across all reports. If that matters, favour Klipfolio, Power BI, or Tableau, where a metric layer or model can enforce consistency. If each client report stands alone, an agency tool will be faster.
Frequently asked questions
What are the best alternatives to Databox for agencies?
AgencyAnalytics, DashThis, Whatagraph, and Klipfolio are the strongest agency picks, with different pricing models. AgencyAnalytics includes white-label branding and SEO tools, DashThis focuses on fast setup, Whatagraph focuses on polished reports, and Klipfolio offers more custom control. Price each by your client count before choosing.
Is there a free alternative to Databox?
Yes, Looker Studio is free for core use and connects natively to Google tools. Third-party connectors for non-Google sources may cost extra, so the total price depends on your sources. For a small in-house team on Google data, Looker Studio is the clear free starting point.
What is the difference between Databox and Power BI?
Databox focuses on KPI dashboards and mobile reporting for marketing and business metrics, with quick setup. Power BI is a full business intelligence platform with data modelling, DAX measures, and deep exploration. Teams that need simple dashboards may prefer Databox-style tools, while teams that need governed analysis should consider Power BI.
How do I migrate dashboards from Databox?
Start by listing each dashboard, its sources, metrics, and viewers, then rebuild the highest-value dashboards first in the new tool. Check that metric definitions match, because different tools calculate similar metrics in slightly different ways. Run old and new reports side by side for one cycle before switching clients over fully.
Which Databox alternative is best for live office displays?
Geckoboard is the best fit for live TV and wall displays, because it is built for glanceable KPIs at a distance. Databox also supported TV displays, but Geckoboard focuses on that use case more directly. For detailed reports alongside a TV display, pair Geckoboard with an agency or BI tool.
Sources we checked (8)

Online Jobs is an independent blog about careers, online work, learning new skills and the tools that help people earn. More about us.
Keep reading
All posts
n8n Alternatives
n8n alternatives compared for 2026, with Zapier, Make, Activepieces, and more, covering visual builders, code steps, self-hosting, and pricing models.

eBay Alternatives
Looking for ebay alternatives? We compared 9 marketplaces for sellers on fees, buyer reach, categories and ease of listing, to help you sell with confidence.

ZoomInfo Alternatives
The best ZoomInfo alternatives in 2026, compared on price, free plans, data coverage, and which tool fits small teams or large sales teams best in detail.