Best Server Monitoring Software in 2026: 8 Tools Compared

How we put this together: we compare official feature and pricing pages, app store listings, privacy policies and public user reviews. Prices change, so check the provider's site before you pay.
Key takeaways
- Datadog suits cloud teams that want metrics, logs, and traces in one place, but its bill needs careful control.
- Zabbix and Nagios XI reward teams that can run their own monitoring server and want no per-host subscription.
- PRTG and Site24x7 are easier starting points for small teams that need broad coverage without a long setup.
- Grafana Cloud fits teams that already use Prometheus or OpenTelemetry and want flexible dashboards.
- Check alert rules, retention, and agent support for your operating systems before you commit to any tool.
Quick comparison
| Name | Who it suits | Starting price | Free option | |
|---|---|---|---|---|
 Datadog | Cloud and container monitoring | $15 per month | Free trial | Visit |
 Zabbix | Self-hosted monitoring at scale | Free | Yes | Visit |
 Nagios XI | Established plugin-based monitoring | See website | Free trial | Visit |
 PRTG Network Monitor | Small teams that want fast setup | Free | Yes | Visit |
 Grafana Cloud | Dashboards on Prometheus data | Free | Yes | Visit |
 New Relic | Application and server observability | Free | Yes | Visit |
 ManageEngine OpManager | Mixed Windows and network estates | See website | Free trial | Visit |
 Site24x7 | Broad monitoring for small teams | See website | Free trial | Visit |
The best server monitoring software
We looked for tools that watch servers, services, and networks in real time, alert the right person quickly, and keep a clear history when something goes wrong.
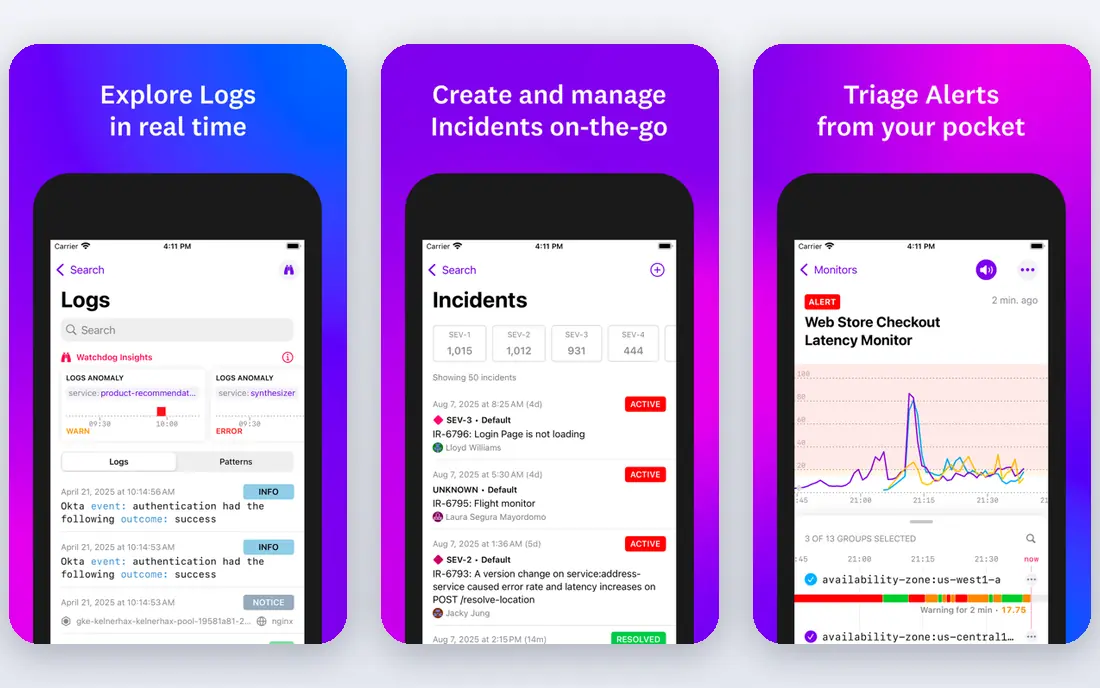
Datadog fits teams that run cloud servers, containers, and many services at once and want one place to check health. Agents collect metrics, logs, and traces, and dashboards can link a slow request back to the host and service behind it. Integrations cover common cloud platforms, databases, and web servers, so a new service often appears in monitoring with little manual work.
The honest catch is cost control. Per-host pricing plus log ingestion and extra products can grow faster than expected, so teams should set limits, drop noisy logs, and review usage each month. If your estate is small and stable, a simpler tool may give you the same alerts for less money and less setup.
- Broad integrations and dashboards
- Logs, traces, and metrics in one view
- Strong alerting and anomaly detection
- Costs can rise with usage and add-ons
- Setup takes time on large estates
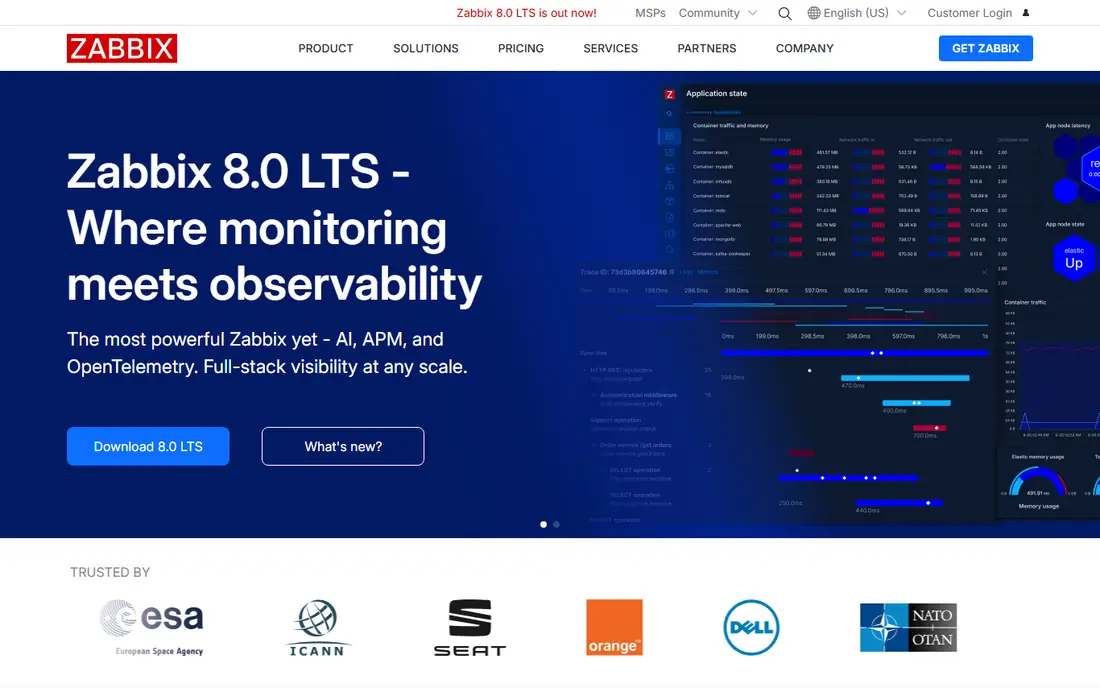
Zabbix fits organisations that want full control and have staff who can run a monitoring server. It collects data by agent, SNMP, and other checks, and templates cover common systems such as Linux, Windows, databases, and network devices. Triggers, graphs, and maps help a team spot a failing disk, a full database, or a down service before users report it.
The trade-off is ownership. You handle upgrades, backups, database growth, and tuning, and a poorly sized database can slow the whole system. For teams with that skill in house, Zabbix is hard to beat on licence cost, and it scales to large estates when it is planned well.
- No per-host licence cost
- Wide support for servers, networks, and services
- Flexible triggers and templates
- Needs server care and tuning
- Interface feels dated next to newer SaaS tools
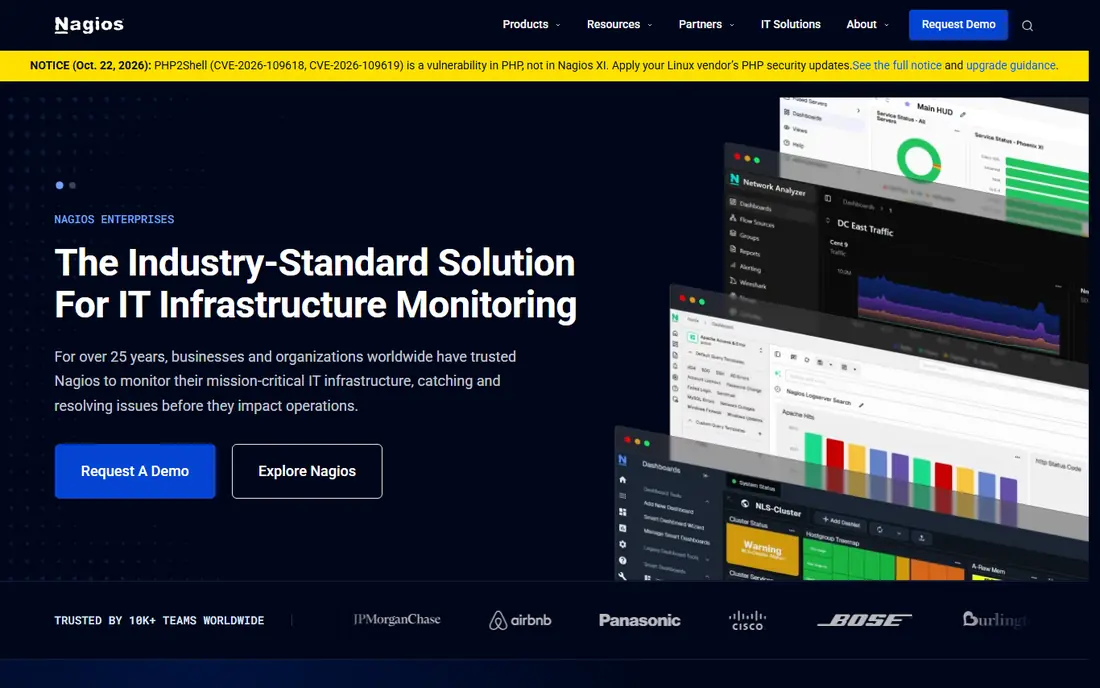
Nagios XI fits teams that already know Nagios checks or need a check for an unusual system. Thousands of plugins cover services, hardware, and applications, and the core idea stays simple: a host is up or down, and each service passes or fails. That clarity helps on-call staff decide what to fix first during an incident.
The catch is effort. Building clean dashboards and keeping configurations tidy takes discipline, and newer tools look more polished out of the box. If your team values a proven check engine and deep plugin coverage over a modern interface, Nagios XI still earns its place.
- Huge plugin library for checks
- Clear host and service status views
- Long track record in IT teams
- Configuration can feel manual
- Modern dashboards need extra work
PRTG fits small and mid-sized teams that want monitoring running the same day. Auto-discovery scans the network, finds servers, switches, and services, and suggests sensors for each one. Maps and dashboards then show status at a glance, and alerts can go by email, push notification, or other channels when a sensor fails.
The catch is sensor counting. Every check uses sensors, so a detailed setup can use the allowance faster than expected, and teams should plan which checks matter most. The free tier still works well for a small office or a single site that needs core server and network coverage.
- Auto-discovery finds devices quickly
- Sensors cover servers, networks, and applications
- Free tier covers up to 100 sensors
- Pricing is tied to sensor counts
- Windows-based core server
Grafana Cloud fits teams that already collect metrics with Prometheus or send OpenTelemetry data. Dashboards are flexible, queries can join metrics and logs, and alert rules can watch the exact signals a team cares about. It also suits teams that want the same dashboards in the cloud and on their own servers.
The catch is that Grafana gives you parts rather than a finished monitoring product. Someone must own dashboards, alert rules, and data retention, or the setup drifts as services change. For teams with that owner, it is a strong and cost-aware choice.
- Flexible dashboards and alerting
- Works with Prometheus and OpenTelemetry
- Useful free tier for small setups
- Needs more assembly than an all-in-one suite
- Alert setup takes care
New Relic fits teams that want server health next to application performance. Infrastructure monitoring shows CPU, memory, disk, and network, while application data shows slow transactions and errors on the same timeline. That link helps a team tell whether a slow page comes from the server, the database, or the code itself.
The catch is usage. Data ingestion and user seats can push costs up, so teams should start with the free tier, keep only useful data, and check the bill early. For application-heavy teams, the combined view often saves enough debugging time to justify the extra care.
- Full-stack view from servers to applications
- Useful free tier for getting started
- Strong query language for exploring data
- Usage-based pricing needs watching
- Depth can overwhelm small teams
ManageEngine OpManager fits IT teams that manage a mix of Windows servers, virtual machines, and network gear. It monitors availability, CPU, memory, and disk, maps devices and links, and can run workflows when a problem appears. That breadth helps a small IT team replace several narrow tools with one console.
The catch is density. There are many views and options, so a new admin should start with core servers and a few key alerts before turning on everything. With that restraint, OpManager gives a practical view of a whole site without needing a large specialist team.
- Covers servers, networks, and virtual machines
- Maps and workflows for IT teams
- Good fit for Windows-heavy sites
- Interface can feel busy
- Pricing needs a quote for larger setups
Site24x7 fits small teams that need one account for servers, websites, and cloud resources. Agents watch server health, synthetic checks watch public pages, and network checks watch key devices, all with alerts when a threshold breaks. Setup is guided, so a team can add its main servers and sites without a long project.
The catch is counting monitors. Each server, website, and check can count toward the plan, so a growing estate needs a periodic review of what is still watched. For a team that wants broad coverage with modest effort, Site24x7 is a sensible starting point.
- Covers servers, websites, networks, and clouds
- Simple setup for many check types
- Alerts by email, SMS, and app
- Per-monitor pricing adds up at scale
- Deepest features need higher tiers
How we picked these
Our method was practical. We checked what each tool monitors, how alerts work, whether it supports common operating systems and cloud platforms, and what the vendor publishes about pricing and free tiers. We favoured tools that are still maintained, work in October 2026, and fit a clear team size or setup, rather than tools that claim to cover every case. Where pricing was quote-based or unclear, we wrote See website instead of guessing a figure.
We also weighed total effort, not just licence cost. A free self-hosted tool can cost more in staff time than a paid SaaS tool, and a rich SaaS tool can cost more in usage than a simpler plan. That is why the list mixes both models, so you can match the tool to your staffing and budget.
How to choose server monitoring software
Start with the servers you cannot afford to lose, then list the signals that prove they are healthy: CPU, memory, disk space, service status, and response time. Add checks for backups, certificates, and key application endpoints, because a server that answers a ping can still serve a broken app. Keep alert rules tight, with a clear owner and a threshold that means action, or your team will learn to ignore alerts.
Next, check retention and access. You need enough history to compare a bad day with a normal day, and you need dashboards that a new on-call engineer can read at 3 a.m. Test the agent on your actual operating systems, confirm it works with your cloud or virtual platform, and run a trial alert end to end before you roll it out widely.
Frequently asked questions
What is the best server monitoring tool for a small business?
For most small teams, PRTG or Site24x7 are good starting points because setup is guided and coverage is broad. Zabbix can work if someone on the team can run a server, but it needs more care. Pick the tool your team will actually maintain, not the one with the longest feature list.
Is there a free server monitoring tool that works well?
Yes. Zabbix is free to use, PRTG has a free tier up to 100 sensors, and Grafana Cloud has a free tier for small setups. Free tiers still need time for setup and alert tuning, so budget staff time even when the licence costs nothing.
How much does server monitoring software cost?
It ranges from free self-hosted tools to per-host SaaS pricing that rises with usage, logs, and extra products. Datadog lists infrastructure pricing from $15 per host per month, while many enterprise tools are quote-based. Always test with your real host count and data volume before signing.
Should I use an agent or agentless monitoring?
Agents give deeper server detail, such as process and disk data, while agentless checks using SNMP or ping are easier for network devices. Most teams use both: agents on key servers and agentless checks for switches, printers, and other devices that cannot run an agent.
What alerts should I set first?
Start with host down, disk full, high CPU or memory over time, failed key services, and expired certificates. Add application checks once those core alerts are reliable. Fewer, trusted alerts beat a long list that your team stops reading.
Sources we checked (8)

Online Jobs is an independent blog about careers, online work, learning new skills and the tools that help people earn. More about us.
Keep reading
All posts
eBay Alternatives
Looking for ebay alternatives? We compared 9 marketplaces for sellers on fees, buyer reach, categories and ease of listing, to help you sell with confidence.

ZoomInfo Alternatives
The best ZoomInfo alternatives in 2026, compared on price, free plans, data coverage, and which tool fits small teams or large sales teams best in detail.

Zoom Alternatives
Zoom alternatives compared for 2026: Google Meet, Microsoft Teams, Webex, Jitsi and more for free calls, large meetings and webinars for teams and classrooms.