Best Reporting Tools in 2026: 8 Tools Compared


Microsoft teams and enterprise reporting · Starting price: $14 per month
How we put this together: we compare official feature and pricing pages, app store listings, privacy policies and public user reviews. Prices change, so check the provider's site before you pay.
Key takeaways
- Power BI is the best value enterprise pick for Microsoft teams, with strong dashboards at a low per-user price.
- Tableau suits teams where visual quality and interactive exploration matter most, but it costs more per creator.
- Looker Studio is the best free starting point for Google teams and small marketing reports.
- Zoho Analytics and Metabase suit small teams and developers who need low-cost reporting without enterprise licensing.
- Check who can view reports for free, since viewer licensing often decides the real cost.
Quick comparison
| Name | Who it suits | Starting price | Free option | |
|---|---|---|---|---|
| Microsoft Power BI | Microsoft teams and enterprise reporting | $14 per month | Yes | Visit |
 Tableau | Visual analytics and exploration | $15 per month | Free trial | Visit |
 Google Looker Studio | Free Google reporting | Free | Yes | Visit |
 Qlik Sense | Deep data exploration | See website | Free trial | Visit |
 Zoho Analytics | Low-cost reporting for small teams | Free | Yes | Visit |
 Metabase | Open source reporting for developers | Free | Yes | Visit |
 ThoughtSpot | Search-driven analytics | $25 per month | Free trial | Visit |
 Domo | Cloud dashboards for executives | See website | Free trial | Visit |
The best reporting tools
Reporting tools must turn raw data into a report someone can act on. Some tools suit analysts who build complex dashboards, others suit small teams that need a clean weekly report without a data team.
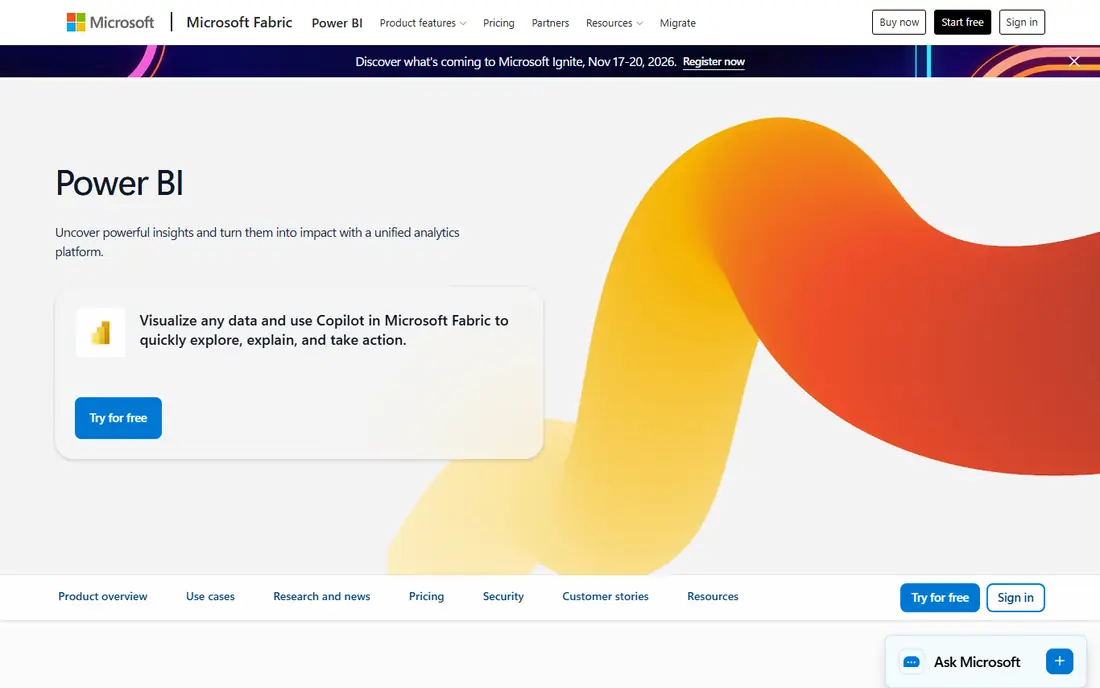
Power BI fits organisations already on Microsoft 365 that need enterprise reporting at a modest per-user price. Pro covers sharing and collaboration, dashboards connect to Excel, SQL, Azure, and many other sources, and the desktop app lets analysts build reports before publishing. That combination makes it the default for many Microsoft teams.
The catch is viewer licensing and DAX. In many setups, each report viewer needs a licence, so a wide audience can cost more than expected, and complex measures need DAX skill. For a Microsoft team with a defined audience, Power BI still offers the best capability per dollar.
- Strong dashboards and data modelling
- Many connectors including Excel and Azure
- Desktop app free for building reports
- Every viewer needs a licence in many setups
- DAX learning curve for complex measures
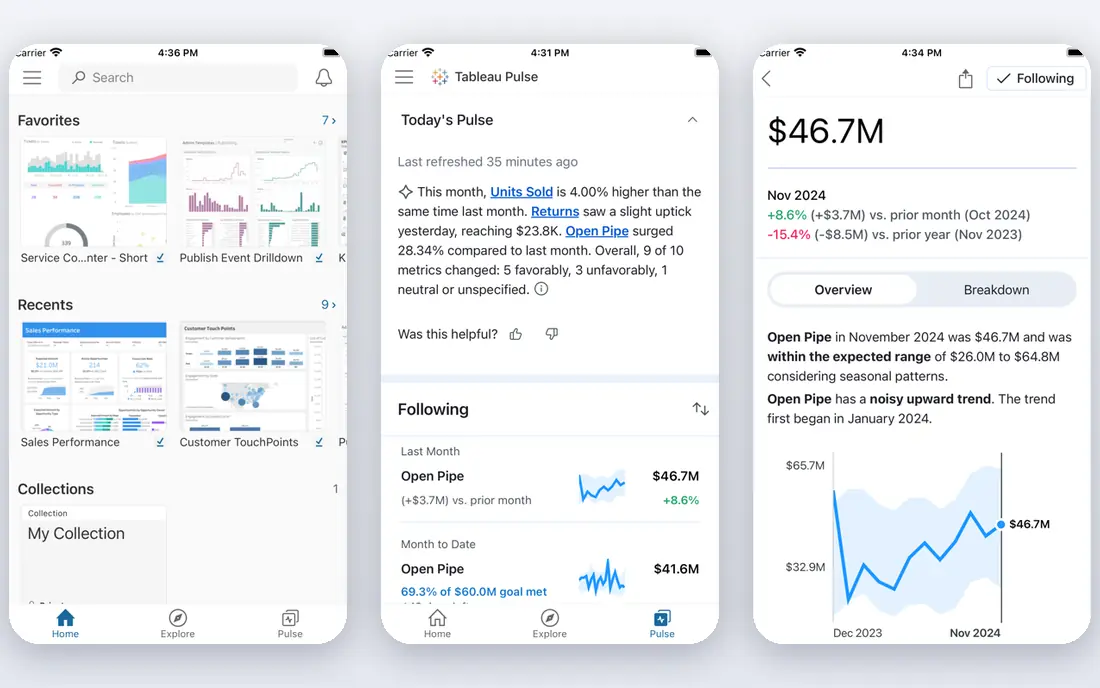
Tableau fits teams where visual quality drives decisions. Drag-and-drop visuals, interactive filters, and storytelling features help analysts explore data and present findings clearly. It handles large datasets well, and its community and learning resources help new analysts grow quickly.
The catch is price. Creator licences cost far more than a viewer licence, and a team with many creators can face a large bill. If visual exploration is the core job and the budget allows it, Tableau is hard to beat. If you only need scheduled reports, a cheaper tool may suffice.
- Best-in-class interactive visuals
- Strong exploration and storytelling
- Wide data source support
- Creator price is high
- Viewer and explorer tiers add cost
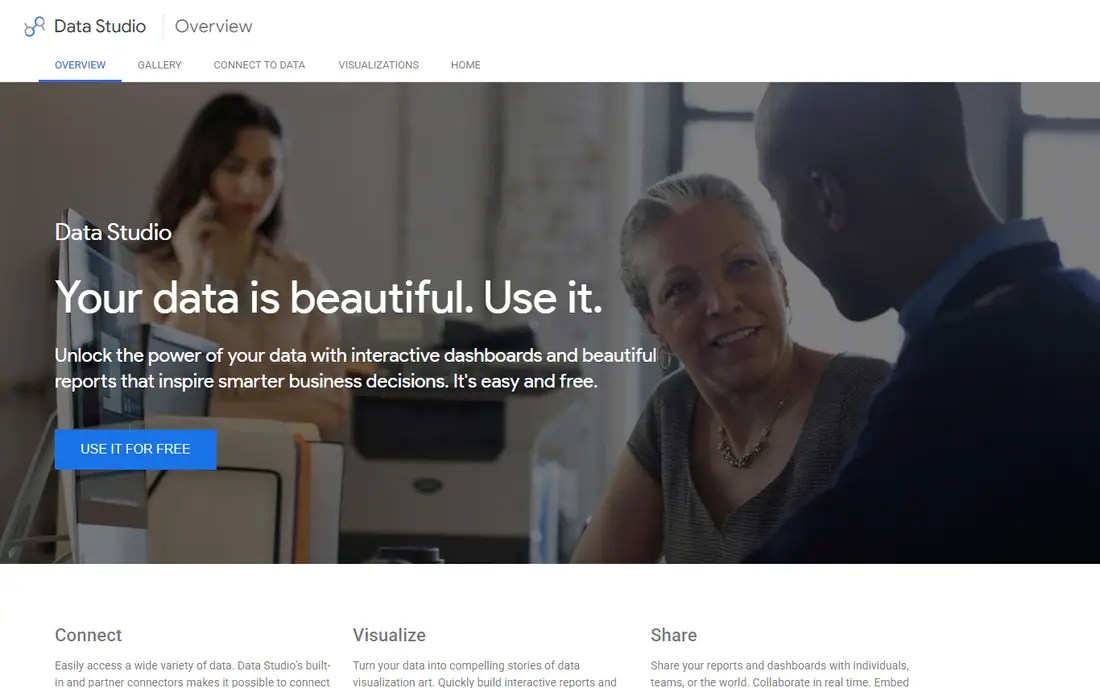
Looker Studio fits small teams and marketers who already use Google tools. It is free for core reporting, connects natively to Analytics, Ads, Sheets, and BigQuery, and sharing is as simple as sharing a doc. For a weekly marketing or sales report, it is often all a team needs.
The catch is scale and governance. Large datasets, complex modelling, and strict access controls are weaker than enterprise BI tools, and Pro adds team features at a per-user cost. For Google-centric reporting, start here and upgrade only when you hit a real limit.
- Free for core reporting
- Native Google Analytics, Ads, and Sheets links
- Easy sharing and collaboration
- Limited governance and scale
- Pro needed for some team features
Qlik Sense fits analyst teams that want to explore data freely rather than follow a fixed dashboard path. Its associative engine lets users click a value and see related data update across the app, which helps discovery and follow-up questions. Data preparation tools help analysts shape sources before reporting.
The catch is learning curve and pricing clarity. New users need time to learn the associative model, and enterprise pricing needs a quote. For teams that value exploration over static reports, Qlik Sense is a strong and distinctive pick.
- Associative engine for free exploration
- Strong data preparation
- Good for analysts who explore without fixed queries
- Learning curve for new users
- Enterprise pricing is quote-based
Zoho Analytics fits small businesses and Zoho users who need affordable reporting. Tiers start low, connectors cover many business apps, and dashboards, reports, and an AI assistant help non-technical users ask questions of their data. The free tier suits a small team testing reporting.
The catch is scale. Very large datasets can slow performance, and enterprise governance is lighter than Power BI or Tableau. For a small team that needs clear reports without enterprise cost, Zoho Analytics is a practical choice.
- Low-cost tiers with many connectors
- AI assistant and dashboards
- Free tier for small use
- Performance can dip on very large data
- Enterprise controls are lighter
Metabase fits startups and developer teams that want simple, open reporting. The question builder lets non-technical users build charts without SQL, while SQL users can write custom queries. Self-hosting keeps data in your own environment, and the cloud option removes server care for a fee.
The catch is governance and scale. It is lighter on enterprise controls than Power BI or Tableau, and cloud costs rise with users. For a team that needs fast, shared dashboards without a heavy BI rollout, Metabase is an excellent fit.
- Open source core for self-hosting
- Easy question builder for non-technical users
- Cloud option for managed hosting
- Governance is lighter than enterprise BI
- Cloud pricing rises with users
ThoughtSpot fits business teams that want to ask questions in plain words and get a chart back. Search-driven analytics lets managers explore sales, pipeline, or usage without waiting for an analyst to build a report. AI assistance helps phrase questions and explain results.
The catch is data readiness. Search works best on clean, well-modelled data, and a messy source will give messy answers. Lower tiers also limit AI queries. For a team with solid data and impatient business users, ThoughtSpot can cut reporting queues sharply.
- Natural-language search for business users
- AI-assisted answers and dashboards
- Good for teams without analysts
- Needs clean, modelled data
- AI query limits on lower tiers
Domo fits larger teams that want an all-in-one cloud platform for executive dashboards. Connectors, data preparation, dashboards, and alerts sit in one place, and mobile access helps leaders check key numbers away from a desk. That breadth suits organisations that want one reporting home.
The catch is cost and credits. Pricing is quote-based with a high floor for many buyers, and the credit model needs careful management as usage grows. For a smaller team, Looker Studio, Zoho Analytics, or Metabase will usually cost far less.
- All-in-one cloud platform
- Executive dashboards and alerts
- Many connectors and apps
- Quote-based pricing with a high floor
- Credit model needs care
How we picked these
We compared tools on dashboard quality, data connectors, modelling, sharing and viewer costs, and published pricing. We checked whether viewers can read reports for free, since that detail often decides the real bill. We favoured tools that are maintained, widely used, and able to produce scheduled reports as well as dashboards, over tools that only offer one view type.
We also weighed who builds reports. A tool that only analysts can use will bottleneck a small team, while a tool that business users can query will spread reporting work. That is why the list mixes analyst tools, search tools, and simple builders.
How to choose a reporting tool
Start with the report your team actually needs each week. Name the audience, the decisions it supports, and the data sources it must pull from. Then test whether the tool can build that report, schedule it, and share it with the right people without manual exports. A beautiful dashboard that no one opens is not a reporting win.
Next, test viewer costs and data freshness. Confirm how many people need to view reports, whether viewers need paid licences, and how often data refreshes. Check connectors for your actual sources, test a report on a phone, and run a trial with real data before you commit to a platform.
Frequently asked questions
What is the best reporting tool for small business?
Looker Studio is best for free Google-based reporting, while Zoho Analytics and Metabase suit low-cost business reporting. Power BI is also strong if your team already uses Microsoft 365. Pick based on your data sources and how many people need to view reports.
Is Power BI free?
Power BI Desktop is free for building reports, but sharing and collaboration need a Pro licence, listed from $14 per user per month. Viewers also need licences in many setups unless capacity licensing is used. Test the sharing model with your real audience size.
What is the difference between Tableau and Power BI?
Tableau leads on visual exploration and interactive analysis, while Power BI leads on value for Microsoft teams and on data modelling at a lower per-user price. Tableau Creator costs more, while Power BI Pro is cheaper for most teams. Choose by workflow, not by brand alone.
Can I create reports without SQL?
Yes. Looker Studio, Zoho Analytics, Metabase, and ThoughtSpot all offer visual builders or search that avoid SQL for common reports. SQL still helps for complex measures and custom logic, but a small team can build useful reports without it.
What should a good business report include?
A good report starts with the decision it supports, shows a few key numbers with context, and explains change over time. It should name the data source and date, avoid clutter, and end with the action or owner. If a reader cannot act on it, the report needs fewer charts and clearer context.
Sources we checked (8)

Online Jobs is an independent blog about careers, online work, learning new skills and the tools that help people earn. More about us.
Keep reading
All posts
eBay Alternatives
Looking for ebay alternatives? We compared 9 marketplaces for sellers on fees, buyer reach, categories and ease of listing, to help you sell with confidence.

ZoomInfo Alternatives
The best ZoomInfo alternatives in 2026, compared on price, free plans, data coverage, and which tool fits small teams or large sales teams best in detail.

Zoom Alternatives
Zoom alternatives compared for 2026: Google Meet, Microsoft Teams, Webex, Jitsi and more for free calls, large meetings and webinars for teams and classrooms.