Best Network Management Software in 2026: 9 Products Compared


Mid-sized IT teams · Starting price: See website
How we put this together: we compare official feature and pricing pages, app store listings, privacy policies and public user reviews. Prices change, so check the provider's site before you pay.
Key takeaways
- ManageEngine OpManager and Paessler PRTG suit small and mid-sized teams that want broad device monitoring without a large enterprise platform.
- SolarWinds Network Performance Monitor and LogicMonitor suit larger, multi-vendor networks that need deeper performance and reporting tools.
- Auvik suits managed service providers and multi-site teams, thanks to automated mapping and cloud-based management.
- Zabbix and LibreNMS suit teams that can self-host and customise, with no licence cost for the core software.
- Free tiers are useful for home labs and small networks, but device, sensor, or data limits matter more than the headline free label.
Quick comparison
| Name | Who it suits | Starting price | Free option | |
|---|---|---|---|---|
| ManageEngine OpManager | Mid-sized IT teams | See website | Free trial | Visit |
 Paessler PRTG | All-in-one small team monitoring | See website | Yes | Visit |
 SolarWinds Network Performance Monitor | Large multi-vendor networks | See website | Free trial | Visit |
 LogicMonitor | Hybrid cloud and on-prem monitoring | See website | Free trial | Visit |
 Auvik | MSP and multi-site networks | See website | Free trial | Visit |
 Zabbix | Self-hosted open-source monitoring | Free | Yes | Visit |
 Nagios XI | Established server and network checks | See website | Free trial | Visit |
 LibreNMS | Free open-source network monitoring | Free | Yes | Visit |
 Datadog | Cloud and infrastructure monitoring | See website | Free trial | Visit |
The best network management software
We compared tools that monitor network devices, servers, and services, with alerts, maps, and reports. The list covers paid platforms, cloud tools, and open-source options, so both small teams and larger IT departments can find a fit.

OpManager monitors routers, switches, firewalls, servers, and virtual machines from one console, using SNMP, WMI, and CLI data. It offers fault alerts, performance graphs, maps, and workflow automation for routine tasks such as restarting a service or backing up a device config. That breadth suits mid-sized teams that manage many device types.
Pricing is device-based, so the total depends on how many devices and interfaces you monitor. Start with a trial on a subset of devices, check alert noise, and plan thresholds before you roll it out to the full network. For distributed sites, the probe-based enterprise setup needs extra planning.
- Broad device coverage
- Fault and performance tools
- Workflow automation
- Enterprise setup takes planning
- Pricing depends on device count
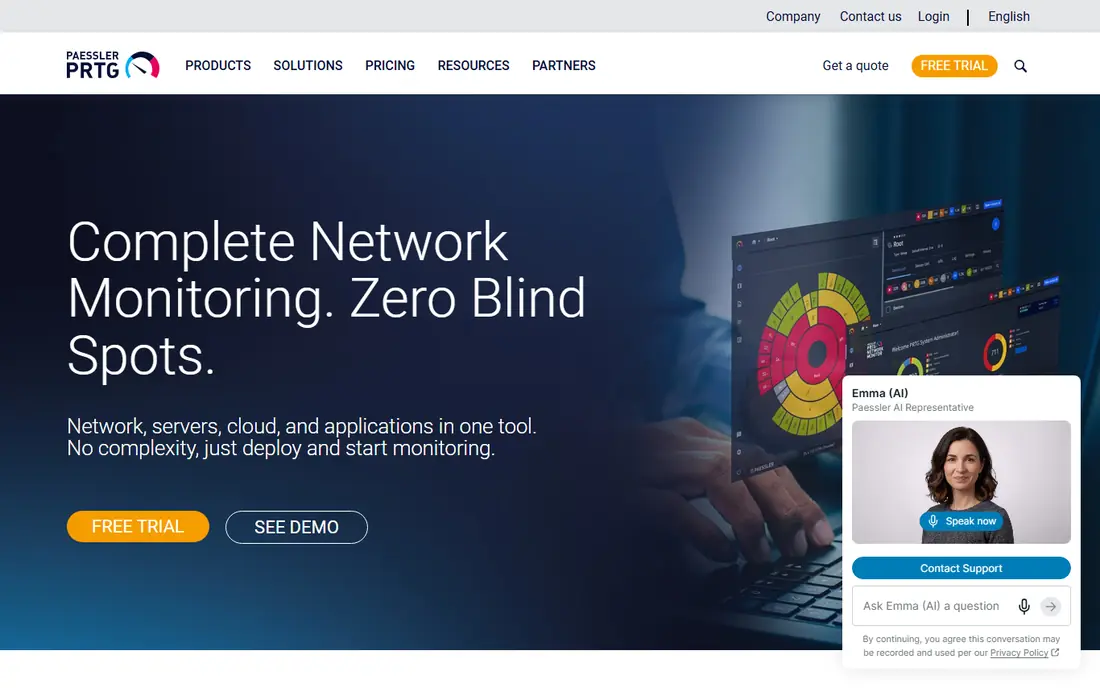
PRTG uses sensors to monitor network devices, servers, applications, and services. Each check, such as ping, traffic, CPU, or disk space, is a sensor, which makes it easy to see what is monitored and what is not. Dashboards and maps give a quick view of health, and alerts can go by email or other channels.
The sensor model is also the main cost factor. A single device can use many sensors, so a small network can grow into a larger licence faster than expected. Use the free tier for a home lab or a small office, and count sensors for your real device list before you buy.
- Sensor-based model is easy to grasp
- Many sensor types
- Clear dashboards
- Sensor counts can grow fast
- Larger networks need careful sensor planning
SolarWinds Network Performance Monitor
Who it suits: Large multi-vendor networks
SolarWinds Network Performance Monitor, often called NPM, is built for larger on-prem networks with many vendors. It monitors device health, interface traffic, and performance, with tools such as NetPath for tracing a path across the network and PerfStack for comparing metrics side by side. Reporting and alerting are detailed, which helps teams that must prove service levels.
That depth comes with cost and setup effort. NPM needs server resources, planning for polling, and care with alert thresholds to avoid noise. It suits teams with a dedicated network role, rather than a small team that needs a quick install and minimal upkeep.
- Deep multi-vendor monitoring
- NetPath and performance analysis
- Strong reporting
- Higher cost and setup effort
- Needs dedicated server resources
LogicMonitor monitors networks, servers, cloud services, and applications from a cloud platform, with collectors placed on site for local devices. It offers a large integration library, dashboards, and alerting, which suits hybrid teams that run both on-prem systems and cloud services. That breadth helps when a problem spans network, server, and cloud layers.
Pricing is typically quote-based, so you will need a sales discussion for a firm figure. The platform also takes time to tune for custom devices and alert rules. For teams that already manage a hybrid estate, that effort is often worth it for a single view across environments.
- Broad cloud and on-prem coverage
- Many integrations
- Alert and dashboard tools
- Quote-based pricing
- Setup takes time for custom devices
Auvik is a cloud-based network management tool that automatically maps devices and connections, which is a major time saver for managed service providers and multi-site teams. It also offers traffic analysis, config backup, and alerting, all managed from the cloud without a large on-prem install.
For a single small office, Auvik may be more than needed, and pricing is quote-based rather than listed as a simple tier. For MSPs that manage many client networks, the automated maps, multi-tenant view, and config tools are the main draw, and a trial on one client site is the best test.
- Automated network mapping
- Cloud management
- Config backup tools
- Pricing is quote-based
- Less suited to a single small home network
Zabbix is a free, open-source monitoring platform for networks, servers, cloud services, and applications. It uses agents and SNMP to collect data, with templates, triggers, and dashboards you can customise in detail. For teams with Linux and monitoring skills, Zabbix can cover a large network at no licence cost.
The cost is time and skill. Installation, database care, template tuning, and upgrades fall to your team, and the interface is powerful but not as guided as a paid tool. Zabbix suits teams that want control and can maintain it, rather than teams that need a fully managed service.
- Free open-source core
- Flexible templates and triggers
- Large community
- Setup and upkeep need skill
- Interface takes time to learn
Nagios XI is the commercial version of Nagios, a long-running monitoring tool for hosts, services, and network devices. It checks availability and performance, sends alerts, and offers dashboards and reports. A large plugin range covers many devices and services, which helps teams with older or unusual systems.
The interface and workflow feel older than newer cloud tools, and custom checks often need plugin setup. For teams that already use Nagios, or that need a stable, well-understood check system, XI is a safe pick. For teams that want modern maps and automated discovery first, Auvik or OpManager may feel easier.
- Long track record
- Many plugins
- Clear host and service checks
- Interface feels dated
- Advanced setup needs plugin work
LibreNMS is a free, open-source network monitoring system with auto-discovery for devices, ports, and services. It supports a wide range of network hardware, with graphs for traffic, CPU, memory, and other metrics, plus alerting. For a home lab, a small business, or a team with open-source skills, it is a strong no-cost starting point.
As with Zabbix, you host and maintain LibreNMS yourself, and support comes from the community and docs rather than a vendor contract. That suits teams that value free software and can handle updates. For teams that need vendor support and service guarantees, a paid platform is a safer choice.
- Free and open-source
- Auto-discovery
- Broad device support
- Self-hosting and upkeep needed
- Support is community-based
Datadog is a cloud observability platform that covers infrastructure, applications, logs, and network performance in one place. Its network tools include flow data, device monitoring, and path checks, alongside server and app metrics. That unified view suits teams that need to trace a problem from a network link to an application.
Pricing is usage-based, so costs depend on hosts, data volume, and features used, and can grow faster than expected if not watched. Datadog is best for teams that already use it for infrastructure or app monitoring and want network data in the same place, rather than for a network-only job on a tight budget.
- Unified infrastructure, app, and network data
- Strong dashboards
- Many integrations
- Usage-based pricing can grow
- Network features sit inside a larger platform
How we picked these
We checked official product pages, pricing pages, and documentation for network management and monitoring tools offered in 2026. We kept tools that monitor network devices and services, provide alerts, and offer maps or dashboards, and we included paid, cloud, and open-source options. We compared device coverage, deployment model, alert and mapping tools, pricing model, and free or trial terms, and we left out tools that only scan a network once without ongoing monitoring.
How to choose network management software
The right tool depends on network size, device mix, hosting preference, and team skill. A home lab and a multi-site enterprise network need different tools, even though both need monitoring.
Count devices and sensors first
List your routers, switches, firewalls, servers, and access points, then estimate checks per device. Sensor-based tools such as PRTG charge by check, while device-based tools charge by device, so the same network can cost very different amounts. A trial with your real device list gives a truer price than a headline tier.
Decide where it will run
Cloud tools such as Auvik, LogicMonitor, and Datadog reduce local server work but need collectors or agents on site. Self-hosted tools such as Zabbix, LibreNMS, and SolarWinds NPM give more control but need server care and updates. Choose the model your team can maintain over time, not just install once.
Tune alerts before you trust them
Set thresholds, test alert routes, and review noise in the first weeks. A tool that alerts on every minor spike will be ignored, while a tool with loose thresholds will miss real faults. Use severity levels, maintenance windows, and escalation rules to keep alerts useful.
Test mapping and reporting
Check that maps show real connections, that reports cover uptime and traffic, and that you can export data for audits or capacity planning. For MSPs and larger teams, multi-site views and role-based access matter as much as the basic ping check.
Frequently asked questions
What is the best network management software?
ManageEngine OpManager and PRTG suit small and mid-sized teams, SolarWinds NPM and LogicMonitor suit larger networks, and Auvik suits MSPs. Zabbix and LibreNMS suit self-hosted teams. The best pick depends on device count, cloud mix, and team skill.
What is the best free network monitoring software?
Zabbix and LibreNMS are free open-source options with broad device coverage, while PRTG offers a free tier for smaller networks. Free tools need self-hosting and upkeep, so factor in team time, not just licence cost, when you compare them.
What is the best free home network monitoring tool?
PRTG free tier and LibreNMS both work for a home lab or a small home network, with device discovery and traffic graphs. For a very simple home setup, a router app or a basic ping tool may be enough, and a full platform may be more work than needed.
What is the best free server monitoring software?
Zabbix and LibreNMS both monitor servers as well as network devices, with CPU, memory, disk, and service checks. Nagios also covers server checks through plugins. Choose based on whether you want a modern dashboard, a plugin range, or a simple agent setup.
Do I need paid network management software?
Not always. Small networks, home labs, and skilled open-source teams can do well with Zabbix or LibreNMS. Paid tools add vendor support, guided setup, automated mapping, and integrations that save time. Pay when the time saved or the support guarantee matters more than the licence cost.
How do I reduce alert noise?
Set thresholds based on real baselines, use severity levels, add dependencies so one device fault does not trigger many alerts, and use maintenance windows for planned work. Review alerts weekly at first, and adjust thresholds for devices that alert too often without a real fault.
Sources we checked (9)

Online Jobs is an independent blog about careers, online work, learning new skills and the tools that help people earn. More about us.
Keep reading
All posts
Best RMM Software
Compare the best RMM software in 2026 for MSPs and IT teams, covering per-device and per-technician pricing, patching, and remote access tools for your team

n8n Alternatives
n8n alternatives compared for 2026, with Zapier, Make, Activepieces, and more, covering visual builders, code steps, self-hosting, and pricing models.

eBay Alternatives
Looking for ebay alternatives? We compared 9 marketplaces for sellers on fees, buyer reach, categories and ease of listing, to help you sell with confidence.