Best Digital Analytics Software in 2026: 8 Tools Compared


Free website and app reporting · Starting price: Free
How we put this together: we compare official feature and pricing pages, app store listings, privacy policies and public user reviews. Prices change, so check the provider's site before you pay.
Key takeaways
- Google Analytics remains the free starting point for most websites, while product teams often need Mixpanel, Amplitude or PostHog for event-level detail.
- Privacy-focused tools such as Plausible, Fathom and Matomo suit sites that want simpler reports and less tracking overhead.
- Microsoft Clarity adds session replay and heatmaps at no cost, which makes it a useful second tool rather than a full replacement for web analytics.
- Prices rise with events, users and page views, so check your actual volume before you judge a plan by its headline price.
Quick comparison
| Name | Who it suits | Starting price | Free option | |
|---|---|---|---|---|
| Google Analytics | Free website and app reporting | Free | Yes | Visit |
 Mixpanel | Product funnels and retention | Free | Yes | Visit |
 Amplitude | Deep product analysis at scale | Free | Yes | Visit |
 PostHog | Product analytics plus replay | Free | Yes | Visit |
 Matomo | Self-hosted privacy control | See website | Yes | Visit |
 Plausible Analytics | Simple privacy-friendly stats | $9 per month | No | Visit |
 Fathom Analytics | Clear traffic reports | $15 per month | No | Visit |
 Microsoft Clarity | Free heatmaps and replays | Free | Yes | Visit |
The best digital analytics software
Most teams do not need the most powerful tool on this list. They need one that answers their next question without a long setup, and that stays affordable as traffic grows. The eight tools below cover that range, from a free default to privacy-first options and full product analytics.
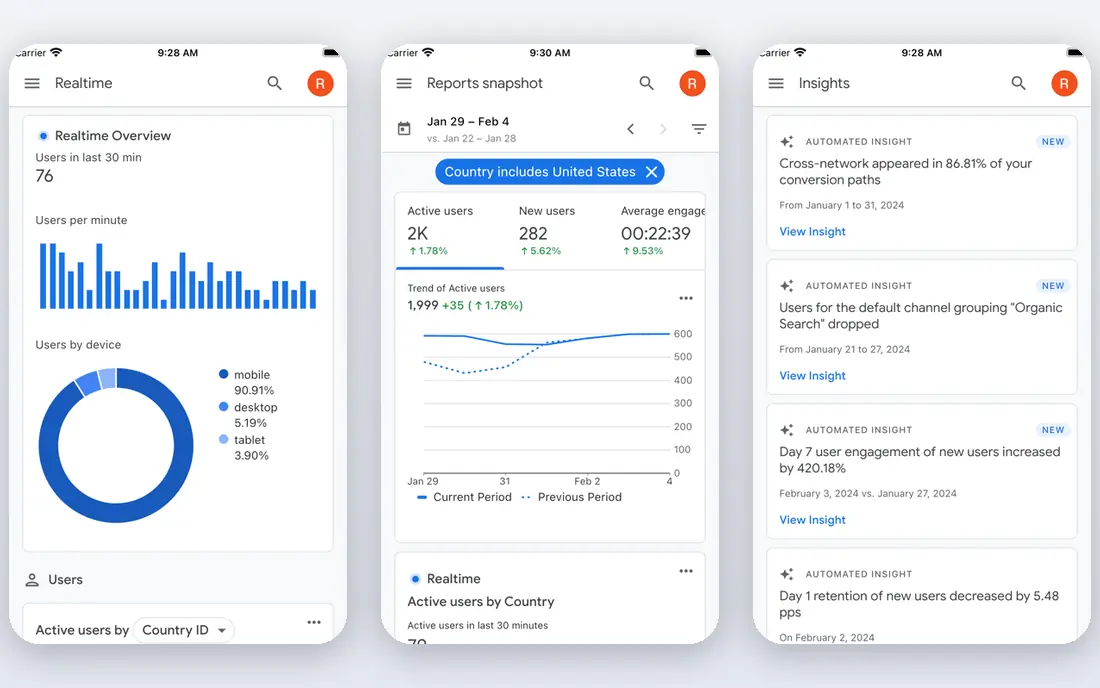
Google Analytics is the sensible default because it costs nothing for standard use and covers traffic sources, pages, conversions and app events in one place. If you run Google Ads, the native link to ad performance is a practical reason to keep it even when you add another tool. Most agencies and freelancers already know it, so help is easy to find.
The catch is that it rewards a clear measurement plan. Without named events and conversions, reports can feel busy and hard to act on. Teams that only check page views will miss much of its value, and teams that want simple, cookieless reporting may prefer a smaller tool. Still, for a first analytics setup, we would start here and add a specialist tool only when a specific gap appears.
- Free for standard use
- Strong Google Ads and Search Console links
- Wide documentation and hiring pool
- Steep learning curve
- Standard data retention limits
- Event setup takes care
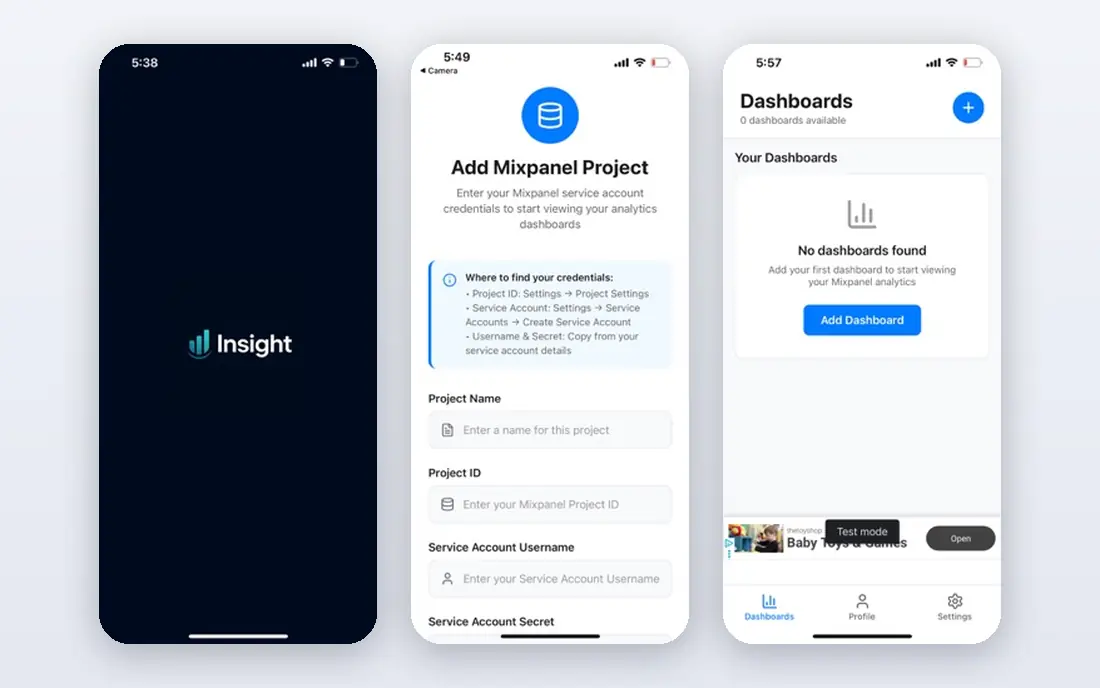
Mixpanel suits teams that care more about what people do inside a product than about where they arrived from. You define events such as sign-up, activation and purchase, then follow users through funnels and retention curves. That focus makes it easier to spot a weak onboarding step or a feature that keeps people coming back.
Setup is the work. A vague event plan produces vague reports, so agree on event names before you install the code. Once that plan is in place, Mixpanel is fast to query and easy for non-analysts to use. It pairs well with Google Analytics: one tool for acquisition, one for product behaviour.
- Clear funnel and retention reports
- Real-time event data
- Generous free tier for early products
- Costs rise with event volume
- Website traffic reporting is less complete than Google Analytics
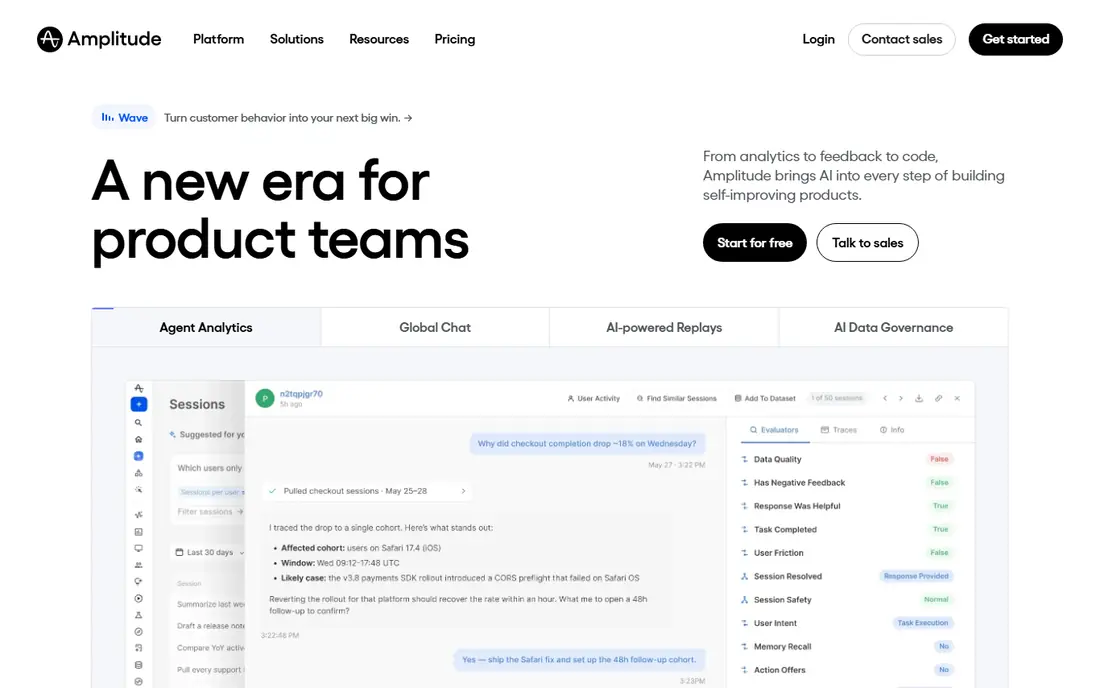
Amplitude is the pick when product questions get more complex, such as which combination of actions predicts long-term retention. Its cohort, journey and retention views handle those questions with less manual work than a spreadsheet export. Larger teams also value the wider platform, which adds experimentation and data management around the core analytics.
That depth is also its drawback for a small team. If you only need funnels and retention, Mixpanel or PostHog may give you the same answer with less setup. Amplitude earns its place when you have enough events, enough users and enough analysts to use the extra analysis. Check the free tier limits against your real monthly volume before you commit.
- Strong cohort and journey analysis
- Experimentation and related product tools
- Free tier for getting started
- Paid plans are priced through sales at higher volumes
- Depth can overwhelm small teams
PostHog appeals to developer-led teams because it bundles several product tools in one place. You can track events, watch session replays, run feature flags and collect surveys without stitching four vendors together. That bundle is useful for a startup that wants to move fast and keep its stack small.
The trade-off is focus. A team that only wants clean website reports may find PostHog more than it needs, and the range of settings takes time to learn. Self-hosting is a real option for teams with privacy or data control needs, but it adds maintenance. For product teams that like one platform, PostHog is a strong and fairly priced choice.
- Analytics, session replay and feature flags in one tool
- Self-hosting option
- Usage-based pricing
- Broad scope can feel busy
- Some features need developer help to set up well
Matomo is the closest open-source match to classic web analytics. It reports visits, sources, pages, goals and conversions in a layout that many Google Analytics users will recognise. The key difference is control: with the self-hosted version, data stays on your own server, which matters for strict privacy policies and regulated work.
That control comes with responsibility for updates, backups and server costs. The hosted version removes that work but prices by traffic, so large sites should get a quote. Matomo fits organisations that want web analytics without sending data to a large advertising platform, and that have someone able to maintain the setup.
- You own the data when self-hosted
- Familiar web reports
- Privacy controls for cookieless tracking
- Self-hosting needs maintenance
- Hosted pricing varies by traffic
- Interface feels dated in places
Plausible is for site owners who open analytics once a day and want a clear answer. The dashboard shows visitors, sources, top pages and goals without layers of menus. The script is small, which helps page speed, and the privacy-first design reduces consent banner work in many cases.
It is not a product analytics tool. You will not get the funnel depth of Mixpanel or the session replay of Clarity. For blogs, marketing sites and small business sites, that simplicity is the point. If your main questions are which pages work and where visitors come from, Plausible answers them quickly.
- Lightweight script
- Simple dashboard
- No cookies by default in its standard setup
- No free plan
- Limited product analytics depth
- Fewer integrations than Google Analytics
Fathom takes a similar approach to Plausible, with an emphasis on a calm dashboard and fast loading. You can track goals, see referrers and check top content without digging through reports. For a marketing site or a small store, that clarity saves time each week.
As with Plausible, the limit is depth. Fathom does not try to replace product analytics, and teams that need cohort analysis will need another tool. Its value is in doing one job well: telling a site owner what happened, in plain terms, without a steep learning curve or heavy tracking.
- Clean and fast dashboard
- Privacy-focused tracking
- Simple goal and event setup
- No free plan
- Less depth for product teams
- Paid tiers scale with page views
Clarity answers a different question from the rest of this list: not how many people visited, but what they did on the page. Heatmaps show where people click and how far they scroll, while recordings reveal confusing layouts and broken forms. That evidence is often more useful than another traffic chart when a page underperforms.
We would use Clarity next to Google Analytics or a privacy tool, not instead of them. It lacks the full acquisition and conversion reporting those tools provide. Used with care around forms and personal data, it is one of the most useful free tools a site owner can add.
- Free heatmaps, session recordings and insights
- Works alongside other analytics
- Simple setup
- Not a full web analytics replacement
- Recordings need care with personal data
- Sampling on very large sites
How we picked these
We started from the jobs analytics tools actually do: measuring traffic, understanding product use, and improving pages. We checked each vendor site and pricing page for current plans, free tiers and stated limits, and we kept only tools that are live and sold in October 2026. Where pricing depends on volume, we said so rather than quoting a figure that would not apply to every reader.
We also weighed fit over feature counts. A long feature list does not help if setup takes weeks or if the dashboard hides the answer. That is why this list mixes a free default, product analytics, privacy tools and a behaviour tool, rather than ranking eight near-identical products. If a tool required a sales call for every price, we marked it as such.
Choosing the right tool for your site
Start with the question, not the tool
Write down the three questions you will check each week. If they are about traffic and conversions, a web analytics tool is enough. If they are about activation and retention inside a product, you need event analytics. If they are about a confusing page, add heatmaps. A tool that matches those questions will get used; a larger tool that does not will sit idle.
Count events and page views first
Free tiers look generous until you count real volume. Add up monthly page views, events and active users from your current setup, then compare that total with each plan limit. Usage-based tools can be cheap at low volume and costly at high volume, so a short trial with real traffic tells you more than a pricing page alone.
Protect privacy from the start
Check what each tool collects, whether it uses cookies, and where data is stored. Privacy-first tools reduce consent work, but they still need a clear privacy notice. For session replay, mask form fields and personal details, and set retention limits that match your policy. A simple setup done well is better than a detailed setup that creates risk.
Plan for two tools, not ten
Many teams do best with one main analytics tool plus Clarity for behaviour. That pair covers acquisition, conversion and page problems without a tangle of scripts. Add a product tool only when product questions become regular. Each extra script adds load and maintenance, so keep the stack as small as the questions allow.
Frequently asked questions
Which digital analytics platform is the best?
There is no single best platform for every site. Google Analytics suits most websites at no cost, Mixpanel and Amplitude suit product teams, and Plausible or Fathom suit sites that want simple privacy-friendly reports. Pick by the questions you need answered each week, not by the longest feature list.
What is the best website analytics tool for a small business?
For a small business site, Google Analytics or Plausible covers the main needs. Google Analytics is free and links well with Google Ads, while Plausible gives a simpler dashboard and a lighter script. Add Microsoft Clarity if you want to see how visitors use key pages.
Are there good free digital analytics tools?
Yes. Google Analytics and Microsoft Clarity are free for standard use, and Mixpanel, Amplitude and PostHog offer free tiers for getting started. Free tiers usually limit events, users or retention, so check those limits against your traffic before you rely on them long term.
What is the best digital analytics tool for product teams?
Mixpanel is a strong starting point for funnels and retention, Amplitude adds deeper cohort and journey analysis, and PostHog bundles replay and feature flags with analytics. The right choice depends on team size, event volume and whether you want one platform or a focused analytics tool.
Should I use more than one analytics tool?
Often, yes, but keep the total small. One main tool for traffic or product data plus Clarity for heatmaps and replays covers most needs. Running many tools at once creates conflicting numbers, slower pages and extra maintenance, so add a tool only for a question your current stack cannot answer.
How much do digital analytics platforms cost?
Costs range from free to usage-based plans that rise with events, users or page views. Simple privacy tools start at $9 to $15 per month in this list, while product analytics free tiers give way to paid plans as volume grows. Always model the price at your actual volume, not at the smallest tier.
Sources we checked (8)

Online Jobs is an independent blog about careers, online work, learning new skills and the tools that help people earn. More about us.
Keep reading
All posts
n8n Alternatives
n8n alternatives compared for 2026, with Zapier, Make, Activepieces, and more, covering visual builders, code steps, self-hosting, and pricing models.

ZoomInfo Alternatives
The best ZoomInfo alternatives in 2026, compared on price, free plans, data coverage, and which tool fits small teams or large sales teams best in detail.

Yotpo Alternatives
Find cheaper alternatives to Yotpo for reviews and loyalty, with Judge.me, Loox, Stamped, and more compared for Shopify stores in 2026, all in one guide.