Best Data Analysis Tools in 2026: 9 Products Compared


Analysts who want deep visualisation · Starting price: $15 per month
How we put this together: we compare official feature and pricing pages, app store listings, privacy policies and public user reviews. Prices change, so check the provider's site before you pay.
Key takeaways
- Dashboard tools and data prep tools solve different problems, so check whether you need both or only one.
- Ecosystem fit drives cost more than headline seat price, especially for Microsoft and Google shops.
- Viewer, explorer, and creator roles change the total price a lot, so model your real user mix.
- Governance and data quality matter more than chart variety once dashboards reach decision makers.
Quick comparison
| Name | Who it suits | Starting price | Free option | |
|---|---|---|---|---|
| Tableau | Analysts who want deep visualisation | $15 per month | Free trial | Visit |
 Microsoft Power BI | Microsoft shops that want affordable BI | $14 per month | Free trial | Visit |
 Qlik Sense | Teams that want associative exploration | See website | Free trial | Visit |
 Looker | Google Cloud firms that need governed modelling | See website | Free trial | Visit |
 Sisense | Embedded analytics for products and teams | See website | Free trial | Visit |
 Domo | Business users who want one BI platform | See website | Free trial | Visit |
 Zoho Analytics | Zoho users and budget-conscious teams | See website | Free trial | Visit |
 Alteryx | Analysts who need data prep and blending | See website | Free trial | Visit |
 KNIME | Teams that want open, code-friendly analytics | Free | Yes | Visit |
The best data analysis tools
Data analysis tools turn raw tables into dashboards, models, and answers, but they differ in who they serve: business users, analysts, or data teams. We compared visualisation, prep, modelling, and governance across tools for different team sizes.
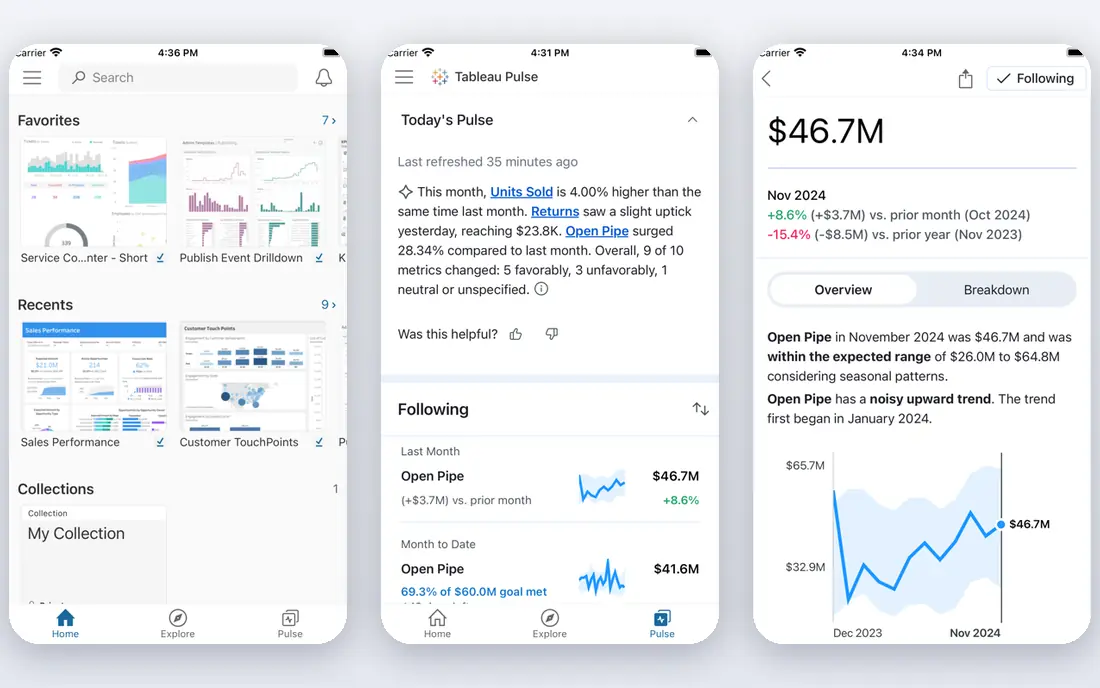
Tableau fits analysts who want deep, flexible visualisation and exploration. The drag-and-drop canvas supports complex charts and ad-hoc analysis that standard reporting tools handle less well.
It suits design-led analyst teams and firms with dedicated data staff, especially where Salesforce or multi-cloud data matters. Tableau Prep helps with basic prep, though complex pipelines may need other tools.
The catch is price by role. Viewer seats start low, but Creator seats cost much more, so model your full user mix before you compare Tableau with cheaper rivals. Before you subscribe, check the vendor pricing page for the current plan, because prices and plan inclusions change, and confirm that the features you need sit on the plan you will actually buy. A short trial with your own data or daily routine will tell you more than a feature list alone.
- Industry-leading visual exploration
- Strong community
- Cross-platform
- Creator seats cost much more
- Steeper learning curve
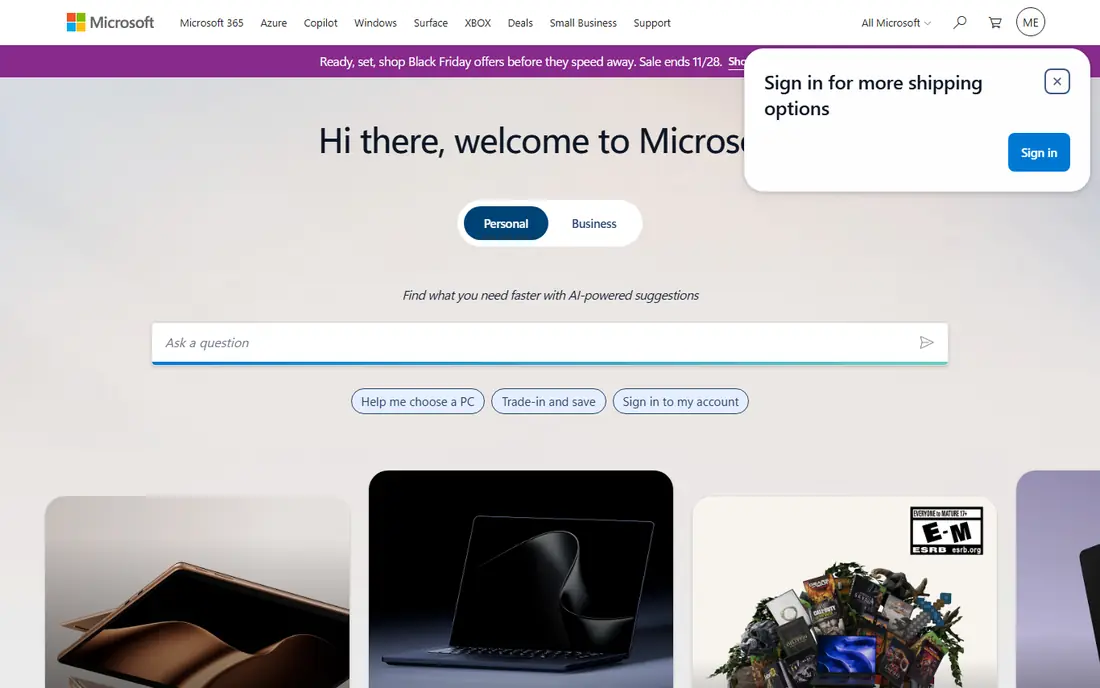
Microsoft Power BI fits organisations already using Microsoft 365 and Azure, where integration keeps costs and friction low. Power Query handles prep, and the service shares dashboards easily across teams.
It suits business users and analysts who need standard reporting at scale, with Copilot features adding AI help for some tasks. The Pro price makes it affordable for large viewer groups.
The catch is platform and modelling depth. Desktop is Windows-only, and advanced DAX models take time to learn, so Mac-heavy teams should test the web workflow first. Before you subscribe, check the vendor pricing page for the current plan, because prices and plan inclusions change, and confirm that the features you need sit on the plan you will actually buy. A short trial with your own data or daily routine will tell you more than a feature list alone.
- Strong Microsoft integration
- Low Pro price
- Power Query prep
- Desktop is Windows-only
- DAX learning curve for advanced models
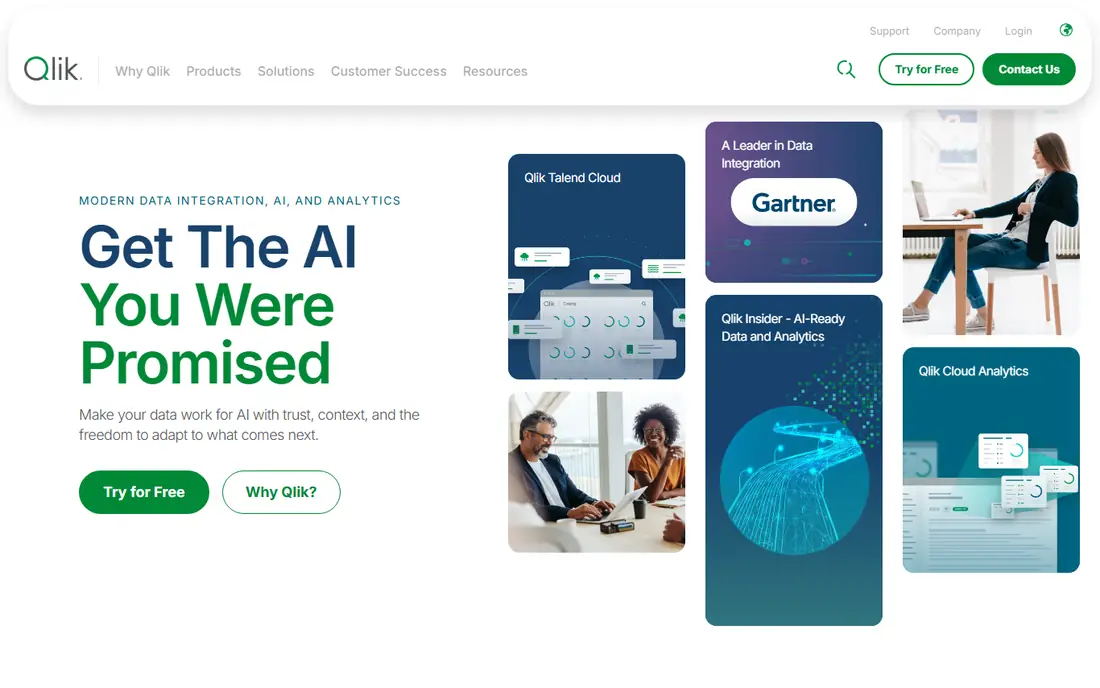
Qlik Sense fits teams that want associative exploration, where selecting one value instantly shows related and unrelated data. That model helps analysts spot gaps and patterns that fixed dashboards can hide.
It suits firms with 200 or more analysts where capacity pricing becomes economical, and teams that want data integration through Talend alongside analytics. AI features help with questions and anomaly detection.
The catch is cost at small scale. Capacity pricing suits larger deployments, so small teams should compare per-user rivals before committing. Before you subscribe, check the vendor pricing page for the current plan, because prices and plan inclusions change, and confirm that the features you need sit on the plan you will actually buy. A short trial with your own data or daily routine will tell you more than a feature list alone.
- Associative engine for free exploration
- AI-assisted insight
- Strong data integration
- Capacity pricing can be costly for small teams
- Learning curve
Looker fits Google Cloud firms that need governed modelling and consistent definitions. LookML lets data teams define metrics once, so every dashboard uses the same logic for revenue, churn, or other key measures.
It suits enterprises with strong data teams and embedded analytics needs, where dashboards must live inside products or portals. Governance and version control are clear strengths.
The catch is technical demand. Setup and modelling need data engineering skill, and pricing is quote-based, so smaller teams may find it heavy for simple dashboards. Before you subscribe, check the vendor pricing page for the current plan, because prices and plan inclusions change, and confirm that the features you need sit on the plan you will actually buy. A short trial with your own data or daily routine will tell you more than a feature list alone.
- Strong data modelling and governance
- LookML definitions
- Embedded analytics
- Needs technical setup
- Pricing is quote-based
Sisense fits firms that want to embed analytics into products or internal portals. Dashboards can live where users already work, with AI-assisted features to help non-technical users explore data.
It suits product teams and mid-size firms that need white-label or embedded reporting without building a BI stack from scratch. Deployment options cover cloud and on-premises needs.
The catch is that pricing is quote-based and setup needs data team time. Test embedding with your own product flow during the trial before you commit. Before you subscribe, check the vendor pricing page for the current plan, because prices and plan inclusions change, and confirm that the features you need sit on the plan you will actually buy. A short trial with your own data or daily routine will tell you more than a feature list alone.
- Embedded dashboards
- AI-assisted analytics
- Flexible deployment
- Quote-based pricing
- Setup needs data team time
Domo fits business users who want connectors, prep, dashboards, and alerting in one platform. Hundreds of connectors help teams pull data from sales, marketing, and operations tools without heavy engineering.
It suits mid-size firms that need fast dashboards and mobile access for managers on the move. Alerts help teams act when a metric crosses a threshold, rather than waiting for a weekly report.
The catch is price at scale. Quote-based pricing can rise as users and data grow, so get a scoped quote with your expected user count and data volume. Before you subscribe, check the vendor pricing page for the current plan, because prices and plan inclusions change, and confirm that the features you need sit on the plan you will actually buy. A short trial with your own data or daily routine will tell you more than a feature list alone.
- All-in-one BI with connectors
- Mobile dashboards
- Alerting
- Quote-based pricing
- Costs rise with scale
Zoho Analytics fits Zoho users and budget-conscious teams that want BI without enterprise pricing. Integration with Zoho CRM and other Zoho apps keeps sales and operations data close to dashboards.
It suits small and mid-size firms that need standard dashboards, scheduled reports, and an AI assistant for questions. The interface is approachable for business users.
The catch is ecosystem and depth. Advanced modelling is lighter than on enterprise platforms, so data-heavy teams should test complex models early. Before you subscribe, check the vendor pricing page for the current plan, because prices and plan inclusions change, and confirm that the features you need sit on the plan you will actually buy. A short trial with your own data or daily routine will tell you more than a feature list alone.
- Affordable BI
- Zoho app integration
- AI assistant
- Smaller ecosystem than largest rivals
- Advanced modelling is lighter
Alteryx fits analysts who spend most time preparing and blending data before analysis. The visual workflow builder lets you clean, join, and transform data without writing code for many tasks.
It suits data teams that feed dashboards in other tools, or that need repeatable prep workflows for regular reporting. Automation helps scheduled data work run without manual steps.
The catch is scope. Alteryx is prep-first, not dashboard-first, so most teams pair it with a BI tool for visualisation and sharing. Before you subscribe, check the vendor pricing page for the current plan, because prices and plan inclusions change, and confirm that the features you need sit on the plan you will actually buy. A short trial with your own data or daily routine will tell you more than a feature list alone.
- Visual data prep and blending
- Automation
- Strong analytics workflows
- Quote-based pricing
- Not a dashboard-first tool
KNIME fits teams that want an open analytics platform with visual workflows and code links. You can build prep, modelling, and machine learning workflows visually, then extend them with Python or R where needed.
It suits data teams, researchers, and analysts who value openness and flexibility over a polished business dashboard. The free desktop platform lowers the barrier to trying real workflows.
The catch is polish and support. The interface can feel technical for business users, and enterprise server features for sharing and scheduling cost extra. Before you subscribe, check the vendor pricing page for the current plan, because prices and plan inclusions change, and confirm that the features you need sit on the plan you will actually buy. A short trial with your own data or daily routine will tell you more than a feature list alone.
- Open analytics platform
- Visual workflows
- Python and R links
- Interface can feel technical
- Enterprise server costs extra
How we picked these
We compared tools that cover data analysis, visualisation, prep, or modelling, and we checked vendor pricing pages for the starting price shown here. Some enterprise tools publish no public price, so we mark those as See website. We looked at visualisation strength, prep, modelling, ecosystem fit, and governance, and we note where desktop tools are free for individual use.
How to choose a data analysis tool
Start with who will use it and what they will build. Business users need drag-and-drop dashboards and governed data, analysts need flexible exploration and calculations, and data teams need modelling, prep, and pipeline control. A tool that suits one group may frustrate another.
Next, check data prep and modelling, not only charts. Many projects stall because data is messy, not because charts look plain. Look for prep tools, joins, calculations, and a semantic layer that keeps definitions consistent across dashboards.
Then model the real price by role. Viewer, explorer, and creator seats cost different amounts, and capacity pricing can beat per-user pricing at scale. Count how many people will view, explore, and build, then compare totals, not only the cheapest seat price.
Finally, test governance and sharing. Check row-level security, version control, scheduled refresh, and how dashboards are shared with people outside the data team. A beautiful dashboard that no one trusts, or that leaks sensitive data, will not survive first contact with real decisions.
Frequently asked questions
What is the difference between BI and data prep?
BI tools focus on dashboards, visualisation, and sharing insights, while data prep tools focus on cleaning, joining, and shaping data before analysis. Many platforms now combine both, but prep depth still varies. If your data is messy, prep strength should weigh heavily in your choice.
Is Power BI free?
Power BI Desktop is free for individual use, but sharing and collaboration need a paid Pro or Premium plan. That distinction matters for teams, because a free desktop tool alone does not give you shared dashboards. Check the Microsoft pricing page for current Pro and Premium rates.
Do I need to code to use these tools?
Most BI tools offer drag-and-drop dashboards without code, but advanced calculations, custom models, and pipelines often need formulas or code. Analysts benefit from learning DAX, SQL, or Python over time, even if business users never touch code. Choose a tool that matches your team skills today and next year.
Which tool is best for small teams?
Small teams often do well with a low-cost BI tool tied to their existing stack, such as Power BI for Microsoft shops or Looker Studio for Google shops. Start with one governed dataset and a few dashboards, rather than buying an enterprise platform. Add prep and modelling tools only when data volume demands them.
How do I keep dashboards trustworthy?
Use one governed dataset with clear definitions, limit who can edit models, and document sources and refresh times on each dashboard. Review key numbers with data owners before sharing widely, and retire dashboards that no longer match current definitions. Trust comes from governance, not chart polish.
Sources we checked (9)

Online Jobs is an independent blog about careers, online work, learning new skills and the tools that help people earn. More about us.
Keep reading
All posts
n8n Alternatives
n8n alternatives compared for 2026, with Zapier, Make, Activepieces, and more, covering visual builders, code steps, self-hosting, and pricing models.

iPhone Alternatives
Looking for iPhone alternatives in 2026? Compare 9 Android phones from Samsung, Google, OnePlus, and more, with cameras, battery life, and honest trade-offs.

eBay Alternatives
Looking for ebay alternatives? We compared 9 marketplaces for sellers on fees, buyer reach, categories and ease of listing, to help you sell with confidence.