Best AIOps Tools in 2026: 10 Platforms Compared


enterprises wanting causal root cause · Starting price: See website
How we put this together: we compare official feature and pricing pages, app store listings, privacy policies and public user reviews. Prices change, so check the provider's site before you pay.
Key takeaways
- Dynatrace and Datadog suit teams that want observability and AIOps in one platform, with different pricing models.
- BigPanda suits estates with many monitoring tools, since it focuses on correlation across those tools.
- PagerDuty suits teams where incident response speed matters more than deep observability.
- Start with alert noise and mean time to resolve, and measure those numbers before and after a trial.
Quick comparison
| Name | Who it suits | Starting price | Free option | |
|---|---|---|---|---|
| Dynatrace | enterprises wanting causal root cause | See website | Free trial | Visit |
 Datadog | cloud native teams consolidating tools | See website | Yes | Visit |
 New Relic | usage based observability with a free tier | See website | Yes | Visit |
 Splunk | log heavy estates and security linked ops | See website | Free trial | Visit |
 PagerDuty | on call teams and incident response | See website | Yes | Visit |
 BigPanda | multi tool estates drowning in alerts | See website | No | Visit |
 LogicMonitor | hybrid infrastructure and managed providers | See website | Free trial | Visit |
 ServiceNow ITOM | ServiceNow customers unifying ops and service | See website | No | Visit |
 IBM Instana | automated observability for dynamic apps | See website | Free trial | Visit |
 Grafana Cloud | open ecosystem teams and dashboards | See website | Yes | Visit |
The best AIOps tools
We compared AIOps platforms on alert correlation, root cause work, automation, and how they fit existing monitoring tools. Some entries are full observability suites, while others are intelligence layers that sit on top of tools you already run.

For teams that want a proven route to both app stores, Dynatrace combines observability with causal analysis that traces a problem to a likely root cause across services. It suits enterprises with complex cloud estates that want fewer false leads during an outage. The trade is cost and setup, since pricing is usage based and the platform rewards careful agent and data planning. Check the current pricing page and the free tier limits before you commit, since plan details change and the entry tier may cap builds, seats, or usage.
- Causal AI for root cause
- Full stack observability
- Strong automation options
- Usage based pricing can be high
- Setup needs care
- Agent based model suits larger estates
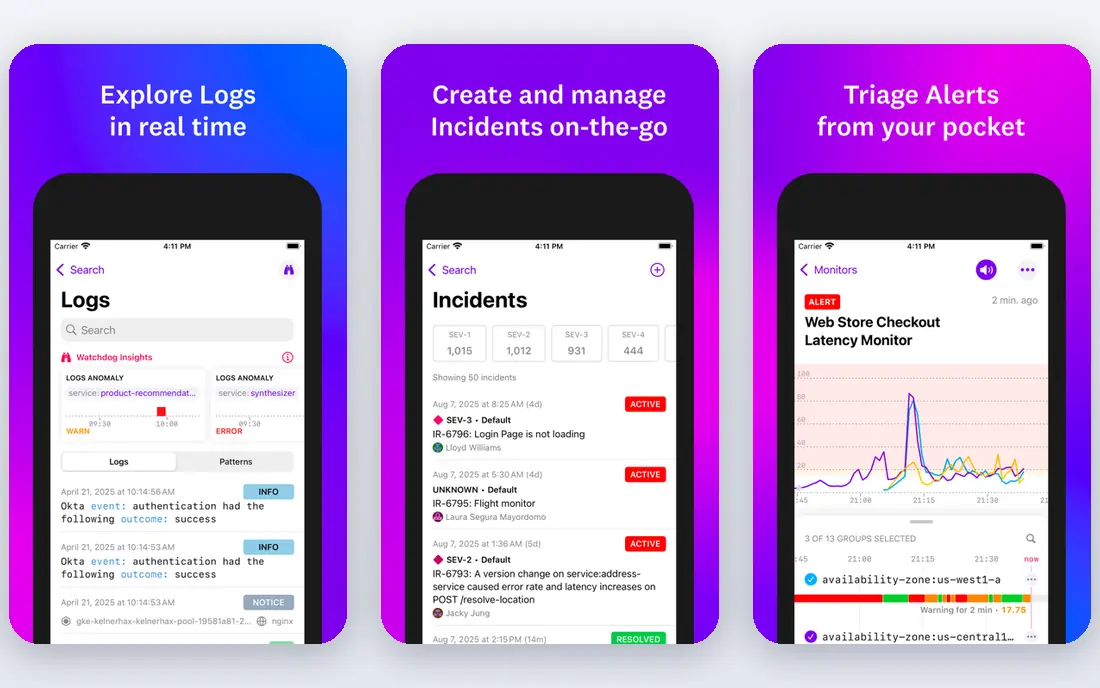
If your team already works in a matching language or stack, Datadog gives cloud teams one place for infrastructure, apps, logs, and security signals, with machine learning features for anomaly detection and alert grouping. It suits teams running dynamic cloud workloads that change often. The trade is billing, since host and ingestion charges add up, so model cost on your peak usage before rollout. Run a small pilot with a real feature from your backlog, and judge it on build time, store submission, and how easy fixes are after release.
- Broad integration library
- Unified logs, metrics, and traces
- Fast setup for cloud teams
- Costs can grow with hosts and data volume
- Module pricing needs careful modelling
- Learning curve for large estates
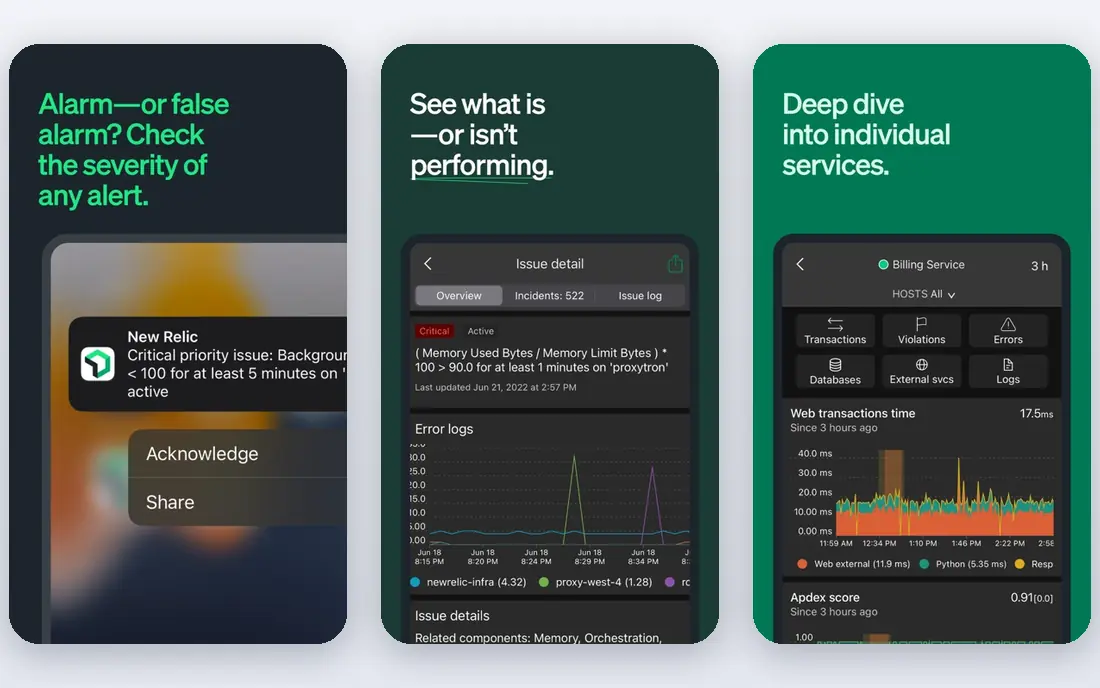
When a single shared codebase matters more than a native look, New Relic offers full stack observability with a free tier that lets small teams test real workloads before paying. Its query tools suit developers who want to dig into traces and logs without waiting for a specialist. The trade is cost control, since usage beyond the free tier is charged, so set alerts on data use early. Ask who will maintain the project in six months, and pick the option your current team can support without hiring for a new language.
- Full stack observability
- Generous free data tier
- Developer friendly query tools
- Enterprise features are quoted
- Data overage costs need watching
- Some teams find pricing complex
As a practical choice for a first release, Splunk is best known for log analytics at scale, with observability and IT service intelligence built on that data. It suits firms that already run Splunk for security or logs and want operations insight from the same data. The trade is cost and skill, since data ingestion pricing and query expertise shape the total bill and the value you get. Check the current pricing page and the free tier limits before you commit, since plan details change and the entry tier may cap builds, seats, or usage.
- Powerful log search and analytics
- Strong security links
- Mature enterprise tooling
- Data volume pricing can be high
- Setup and query skills are needed
- Smaller teams may find it heavy
For projects where design control is the main concern, PagerDuty focuses on getting the right person to an incident fast, with alert grouping, schedules, and response workflows. It suits DevOps teams where response speed and clear ownership matter most. The trade is scope, since it pairs best with an observability tool rather than replacing one for deep diagnostics. Run a small pilot with a real feature from your backlog, and judge it on build time, store submission, and how easy fixes are after release.
- Strong on call scheduling
- Alert deduplication
- Response automation and reporting
- Full AIOps depth needs higher tiers
- Per user pricing grows with team size
- Observability is not its core
Where speed of setup beats depth of customisation, BigPanda sits above existing monitoring tools and correlates their events into fewer, clearer incidents. It suits large firms where alerts come from ten or more tools and triage time is the main pain. The trade is dependence, since poor data from source tools limits correlation quality, so clean up feeds during setup. Ask who will maintain the project in six months, and pick the option your current team can support without hiring for a new language.
- Event correlation across many tools
- Noise reduction
- Incident timelines and topology views
- Quoted pricing
- Needs clean data from source tools
- Value depends on tool sprawl
If you need to reuse web skills for a mobile release, LogicMonitor covers hybrid infrastructure with monitoring, forecasting, and alert correlation for servers, networks, and cloud. It suits managed providers and firms with a mix of old and new infrastructure. The trade is unit pricing, since device counts drive cost, so count every monitored resource before quoting. Check the current pricing page and the free tier limits before you commit, since plan details change and the entry tier may cap builds, seats, or usage.
- Hybrid cloud and on premises coverage
- Anomaly detection
- Good fit for managed service providers
- Pricing is per device and resource
- Interface can feel busy
- Advanced AI features sit on higher tiers
For a smaller team that wants to keep maintenance simple, ServiceNow ITOM adds operations intelligence to the ServiceNow platform, linking service maps, events, and incident workflows. It suits firms already running ServiceNow for service management who want operations in the same system. The trade is lock in, since value is highest inside ServiceNow, so firms without it should compare standalone options first. Run a small pilot with a real feature from your backlog, and judge it on build time, store submission, and how easy fixes are after release.
- Service mapping
- Workflow automation
- Tight link to incident and change records
- Needs a ServiceNow base
- Pricing is modular and quoted
- Implementation can be long
When the app must reach several device types at once, IBM Instana discovers services automatically and tracks them with fine grained data, which suits container and microservice estates that change often. It reduces manual setup for teams that deploy several times a day. The trade is cost modelling, since consumption pricing varies with workload, so test on a real service before rollout. Ask who will maintain the project in six months, and pick the option your current team can support without hiring for a new language.
- Automatic discovery
- Fine grained data
- Strong container and microservice coverage
- Consumption pricing needs modelling
- Smaller community than leaders
- Enterprise focus
As an option for teams with a clear existing workflow, Grafana Cloud builds on the open Grafana ecosystem with managed metrics, logs, and traces plus dashboards teams already know. It suits teams that want open standards and control over their stack. The trade is maturity of AI features, since correlation and automation depth is still growing compared with the largest suites. Check the current pricing page and the free tier limits before you commit, since plan details change and the entry tier may cap builds, seats, or usage.
- Open source roots
- Flexible dashboards
- Prometheus and OpenTelemetry support
- AIOps features are newer than leaders
- Self hosted setup needs skill
- Support tiers affect cost
How we picked these
We compared official feature pages, pricing pages, app store listings, and public reviews for each product, and we kept only products that exist and fit the topic today. Where a price or free tier could not be confirmed on a vendor page, we wrote See website rather than guessing a number. We also weighed fit for different team sizes, since a tool that suits a large enterprise may be a poor fit for a small team, and the reverse is also true. Products that needed a workaround for the core job, or that had closed or changed focus, were left out.
How to choose an AIOps platform
Start from the noise problem
Count alerts per week, duplicate alerts, and time spent triaging before you buy. A platform should cut noise and point to a likely cause, not just add another dashboard. Set a target for those numbers during a trial.
Check data and integration fit
List your cloud, servers, apps, and existing monitoring tools, then check native integrations and data costs. Usage based pricing can grow fast with log volume, so model cost on your real data, not a demo data set.
Control automation carefully
Let the platform suggest fixes and group incidents first, and keep human approval for restarts, rollbacks, and changes that affect customers. Automation without guardrails can turn a small fault into a wider outage.
Frequently asked questions
What is the best AIOps platform for a small team?
A small team should start with a tool that offers a free tier or a low entry price, such as Datadog, New Relic, or Grafana Cloud. Test alert grouping on real incidents before paying for enterprise features.
What is the difference between AIOps and observability?
Observability collects logs, metrics, and traces. AIOps uses that data to group alerts, find likely causes, and suggest or run fixes, so teams spend less time triaging.
Do AIOps tools replace monitoring tools?
Some do, since they include observability. Others sit on top of existing tools and focus on correlation, so you can keep current monitoring and add intelligence.
How is AIOps pricing usually charged?
Pricing may be per host, per user, per data volume, or quoted. Check how your data volume and host count affect cost, and ask for a cost model based on your current usage.
Can AIOps tools fix incidents on their own?
Some can run approved playbooks for known faults, such as restarting a service. High impact actions should still need human approval, with clear logs of every automated step.
Sources we checked (10)

Online Jobs is an independent blog about careers, online work, learning new skills and the tools that help people earn. More about us.
Keep reading
All posts
n8n Alternatives
n8n alternatives compared for 2026, with Zapier, Make, Activepieces, and more, covering visual builders, code steps, self-hosting, and pricing models.

iPhone Alternatives
Looking for iPhone alternatives in 2026? Compare 9 Android phones from Samsung, Google, OnePlus, and more, with cameras, battery life, and honest trade-offs.

eBay Alternatives
Looking for ebay alternatives? We compared 9 marketplaces for sellers on fees, buyer reach, categories and ease of listing, to help you sell with confidence.