Best Stock Charting Software in 2026: 8 Platforms Compared

How we put this together: we compare official feature and pricing pages, app store listings, privacy policies and public user reviews. Prices change, so check the provider's site before you pay.
Key takeaways
- TradingView is the easiest starting point for most people because it has a usable free plan, broad market coverage and a large library of shared indicators.
- StockCharts suits readers who want clean charts and strong education, while TrendSpider suits traders who want automation and no-code backtesting.
- Broker charting tools such as thinkorswim can be free with an account, but they tie you to that broker for trading.
- Data fees, exchange fees and add-ons can change the real cost, so check the vendor pricing page for the markets you follow.
Quick comparison
| Name | Who it suits | Starting price | Free option | |
|---|---|---|---|---|
 TradingView | Most chart users | Free | Yes | Visit |
 StockCharts | Clean charts and learning | $19.95 per month | Free trial | Visit |
 TrendSpider | Automated analysis | See website | See website | Visit |
 TC2000 | Scanning and charting value | Free | Yes | Visit |
 MetaStock | Long term charting | See website | Free trial | Visit |
 eSignal | Professional data and charts | See website | Free trial | Visit |
 NinjaTrader | Futures and active traders | See website | See website | Visit |
 thinkorswim | Schwab account holders | Free | Yes | Visit |
The best stock charting software
This is not financial advice. Trading carries risk, and past price patterns do not guarantee future results. Use charting tools to study price history, test ideas and manage risk, not as a promise of profit. The tools below differ in price, data coverage, automation and how much coding they expect from you. We compared official pricing pages, feature pages and app store listings to match each platform to a clear use case, from a free chart for a new investor to a full automation setup for an active trader.
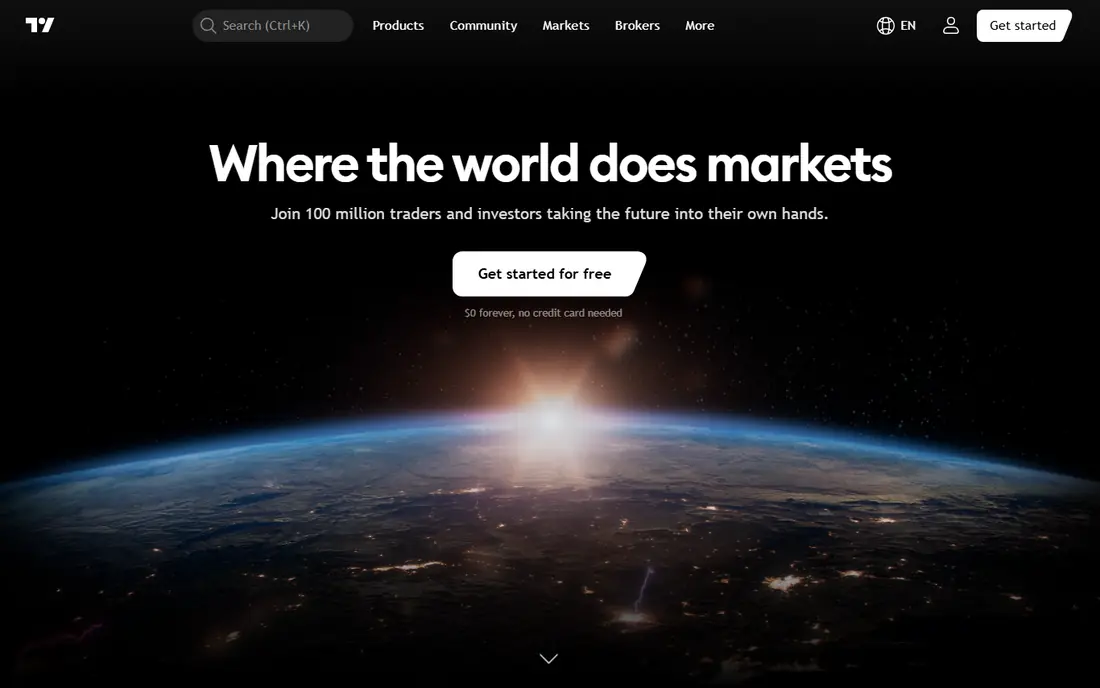
TradingView is our pick for most people because the free plan is genuinely usable for everyday chart work. You can follow stocks, funds, futures, forex and crypto, draw trendlines, add common indicators and save basic layouts. The browser version means you can open a chart on almost any computer without installing desktop software. For many readers, that is enough to study a stock before deciding what to do next.
The limits show up when you want more. The free plan restricts how many indicators you can add to one chart, how many alerts you can set and how many layouts you can save. Paid plans raise those limits and add faster data refresh and more features. If you only check a few charts a week, stay free. If you watch many symbols each day, compare the paid tiers against what you actually use.
- Broad market coverage and many chart types
- Large shared indicator library
- Works in a browser and on mobile
- Free plan limits indicators, alerts and layouts
- Paid tiers rise in price for heavier use
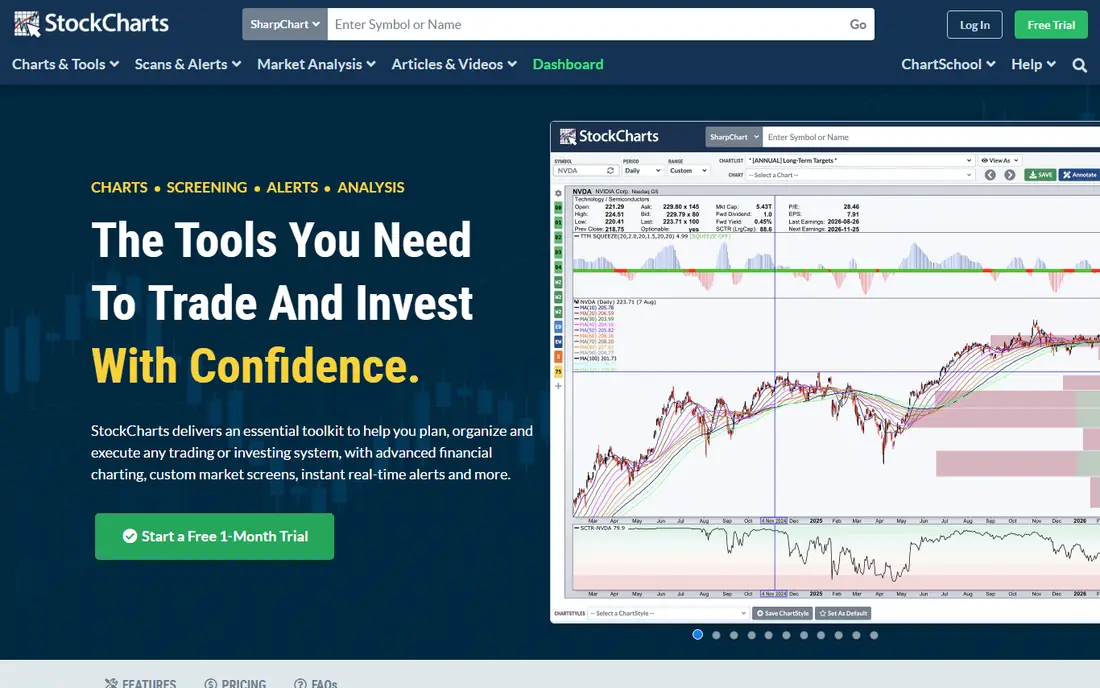
StockCharts appeals to people who want a chart that is easy to read and a scan library that is ready to use. Its predefined scans help you find stocks by trend, momentum or other common conditions without writing code. ChartSchool, its education section, explains indicators and chart patterns in plain terms, which helps newer readers learn what each tool on the chart actually shows.
The trade-off is scope. StockCharts is strongest for US stocks and less broad than TradingView for global markets and crypto. Paid plans start at a monthly rate shown on the vendor pricing page, and they add more scans, layouts and data options. If you want a calm, focused charting site with good learning material, StockCharts is a strong choice.
- Clear charts and predefined scans
- ChartSchool education material
- Strong focus on US stocks
- Less global and crypto depth than TradingView
- Paid plans needed for full scans and intraday data
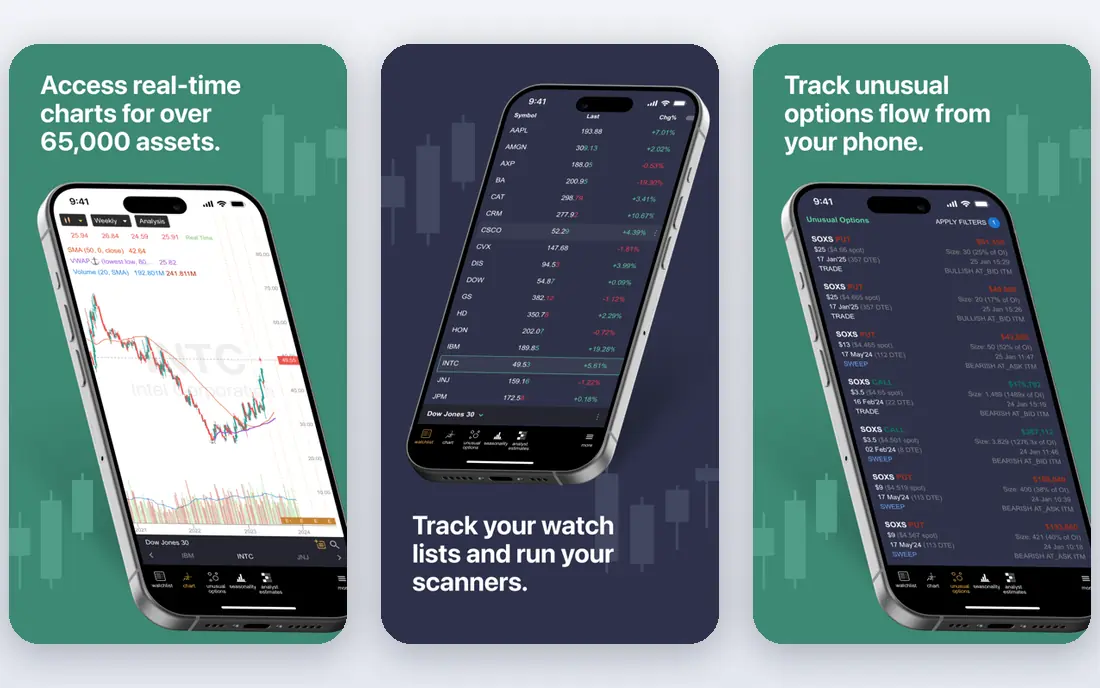
TrendSpider is built for traders who want the software to do part of the chart work for them. It can draw trendlines, flag support and resistance zones and run scans across many symbols and timeframes. Its Strategy Tester lets you test a rule-based idea against past data without writing code, which is useful if you want to check an idea before risking money. Alerts can be set to stay active without the expiry limits some free tools impose.
That automation comes at a higher price, and the plan you choose affects data detail and scan frequency. Check the current pricing page, including any trial fee, before signing up. TrendSpider earns its cost only if you will use automation, scans and backtesting each week. If you mainly draw charts by hand, a cheaper tool will do the same job.
- Automated trendlines and pattern detection
- No-code backtesting
- Multi-timeframe scans and alerts
- Higher price than basic charting tools
- Trial terms and data add-ons need careful checking
TC2000 has long been a value choice for traders who scan and chart US stocks. Its EasyScan tool and custom formula options let you build scans around price, volume and indicator conditions. The charting set includes a wide range of indicators, and the platform runs on desktop and on the web. For a trader who starts each session with a scan list, that workflow is efficient.
The look and feel may not suit everyone. New users sometimes find the layout less polished than TradingView, and some data and trading features sit on paid tiers. Check which plan includes the real-time data you need, and try the free version first. If scanning is your main job, TC2000 offers a lot for the price.
- Strong scanning with custom formulas
- Many indicators
- Desktop and web versions
- Interface can feel dated to new users
- Real-time data and broker features cost extra on some plans
MetaStock is one of the older names in charting software, and it still suits traders who study charts in depth. It offers a large indicator set, charting tools and system testing for rule-based ideas. Desktop users who like to keep a dedicated charting workspace, with saved layouts and watchlists, will find the setup familiar and flexible.
The main drawback is access. Pricing is not always shown as a simple monthly list, so you may need to request a quote or check the current product page for the version you want. New traders may also face a steeper learning curve than with a browser-first tool. MetaStock fits experienced chart readers better than a first-time investor who just wants a quick price chart.
- Deep indicator library and system testing
- Long history in charting
- Desktop focus for serious study
- Pricing is by quote on some plans
- Learning curve for new traders
eSignal is aimed at active and professional traders who need fast, reliable data and advanced charting. It covers many markets, offers detailed chart types and supports custom studies and scans. Traders who watch futures, forex and stocks together, and who need data that updates quickly, often shortlist eSignal for that reason.
Cost and complexity are the catches. Pricing depends on data packages and add-ons, so the headline price is not the full monthly cost. Casual investors who check charts a few times a week will not use enough of eSignal to justify it. Active traders who trade daily and need depth of data are the audience it serves best.
- Fast data and advanced charting
- Wide market coverage
- Tools for active traders
- Higher cost and complex pricing
- More system than a casual investor needs
NinjaTrader is best known for futures trading, but its charting and analysis tools also cover stocks and forex through supported brokers and data feeds. Traders can use advanced chart types, build custom indicators and practise with simulated trading before using real money. That practice mode is useful for learning how orders and charts work together.
Stock-only investors may find the futures focus less relevant, and the total cost depends on broker and data choices rather than one simple subscription. Check the vendor site for current platform, brokerage and data terms. If futures are part of your trading, NinjaTrader is a serious contender. If you only follow stocks, a stock-first charting tool may be simpler.
- Strong futures charting and order tools
- Simulated trading for practice
- Large indicator ecosystem
- Futures focus may not suit stock-only investors
- Broker and data fees apply separately
thinkorswim is Schwab trading software, and it is free for Schwab clients with no account minimum stated on its product pages. It combines charting, scanning, options analysis and paperMoney simulated trading in one desktop and mobile platform. Traders who already hold a Schwab account get a professional charting set without a separate monthly charting subscription.
The catch is the account link. You need a Schwab account to use it, and the platform has a learning curve because it packs many tools into one workspace. Beginners may prefer a simpler charting site at first, then move to thinkorswim as they learn. For Schwab clients who trade actively, it is hard to beat on value.
- No platform charge for Schwab clients
- Strong scanning, charting and paper trading
- Options tools included
- Requires a Schwab account
- Platform can feel complex for beginners
How we picked these
We compared official pricing pages, feature pages and app store listings for charting tools that are actively sold in the United States. We looked for tools that cover real charting work: multiple chart types, indicators, scans, alerts and backtesting or simulated trading where relevant. We included free, broker and paid options so readers at different budgets could compare. We did not claim hands-on testing, and we did not treat a chart pattern or indicator as proof that a trade will profit. Prices change often, so check the vendor page before you buy.
How to choose a charting platform
Start with the markets you follow. A US stock investor needs different data from a futures trader or a crypto trader, and data fees vary by market. Next, decide how much automation you want. If you draw charts by hand and use a few indicators, a free or low cost tool is enough. If you want scans, alerts and backtesting every day, pay for a tool built for that work and use the trial to test it on your own watchlist.
Also check data quality and cost together. Some tools include real-time US stock data on all plans, while others charge extra for real-time data or for specific exchanges. Add those fees to the subscription price before comparing. Finally, test the mobile app if you check charts away from a desk. A desktop platform that is hard to use on a phone may not fit how you actually follow the market.
A note on risk and data
This is not financial advice, and charting software does not remove trading risk. Backtests use past data and can look better than live results, especially if a strategy was tuned to fit that past period. Use position sizing, stop orders where suitable and a practice account to learn a platform. If a vendor or social post promises guaranteed returns from a chart setup, treat that claim with care and check the source.
Frequently asked questions
What is the best stock analysis software?
The best stock analysis software depends on how you analyse stocks. TradingView fits most chart users, StockCharts fits readers who want clean charts and education, and TC2000 fits scan-first traders. Compare data coverage and price for the markets you follow.
What is the best stock analysis app free?
TradingView and TC2000 offer free tiers with limits, and StockCharts offers a free trial. Free plans usually limit indicators, alerts and layouts, so they suit light use. Check each vendor page for current free plan limits.
What is the best free stock analysis app for beginners?
For beginners, TradingView free plan and StockCharts trial are good starting points because they are easy to open in a browser and include common indicators. Start with a few indicators, learn what each one shows, and avoid adding many tools to one chart at once.
What are the best stock charting platforms for automation?
TrendSpider leads on automation with automated trendlines and no-code backtesting. TradingView also supports backtesting through its scripting language, and NinjaTrader supports custom indicators and simulated trading. Automation helps test ideas, but it does not guarantee live results.
What is the best stock market analysis app for active traders?
Active traders often choose thinkorswim if they hold a Schwab account, eSignal for professional data, or NinjaTrader for futures. The right choice depends on your broker, the markets you trade and whether you need fast data or advanced order tools.
Is charting software enough to trade well?
No. Charting software shows price and volume history, but trading also needs risk management, position sizing and a plan for losses. Use charts as one part of a wider process, practise with simulated trading where available, and never risk money you cannot afford to lose.
Sources we checked (8)

Online Jobs is an independent blog about careers, online work, learning new skills and the tools that help people earn. More about us.
Keep reading
All posts
Wise Alternatives
Compare the best Wise alternatives in 2026, from Revolut and Remitly to OFX and Xe, with fees, speed, cash pickup options, and honest trade-offs today.
Top AI Financial Software
Searching for top AI financial software? We compared 9 AI finance tools for AP, spend, close, forecasting and bookkeeping to help teams choose wisely.
Quicken Alternatives
Compare the best quicken alternatives for Mac, Windows, and small business owners, from Monarch Money and YNAB to Copilot, Tiller, and Banktivity in 2026.